Thanks. Appreciate the generous sharing. 
Kazerin ( Date: 04-Mar-2021 14:38) Posted:
|
" always ask yourself are you getting a discount for long, and are you getting a premium for short and you will be safe"
CNY already over leow but Bee Cheng Hiang is still selling their Bak Kwa at CNY prices. NABEH.
Meaning, based on the professor' s proprietary " Kazerin' s Method" , if I LONG Bak Kwa now I will be paying a premium, not getting a discount.
So I cannot long for Bak Kwa now (pun definitely intended).
Just like when eating Cha Kway Teow, must definitely eat the hum also.
Becoz really, there is no harm in eating hum ....pun most definitely intended again.
Look at the daily chart and the blue zone and why i highlight that zone
because that was the zone that creates an imbalance.
Imbalance means only 1 winner , either bulls or bears
After price leave that zone , it creates 3 strong bullish candles.
I will not have buy right now because if the zone still got institutional orders left, price will have reject it and go up. Instead it is absorbing.
Eg. BB needs to fill 1000 lots and his orders only got fill 500 lots and price cheong up... so when price returns back to this zone, there are still pending 500 lots to be fill and First time back (FTB) maybe fill 200 lots, then price cheong above,... 2nd time back still got balance 300 lots... and maybe this time all orders are filled. Then price cheong above and next time when it comes back to this zone, do you think the zone will hold ? of course not because no more pending order by institutional or BB. so this zone will get remove.
and the other point is, after first time back, people who bought previous and at first time back will have their SL below the demand zone so once all pending orders at the zone are filled, zone cant hold and get removed and all stop losses are triggered.
When i buy or long, to cover my stop loss position, i will have a pending sell orders below.
On BB screen, they do not know where is your stop loss
But they do know where is the area on the chart there are pending orders.
Price always seek liquidity in order to move the market, they are like petrol to the car....
In my previous post on cict , i mentioned certain price point will be my TP because that is where all the stop loss aka pending orders are.....
Do this simple exercise to train our eyes and ask yourself these few questions.
1) Who are the ppl in money nw and who are the ppl in loss now, is it the bulls or the bears
2) where will their stop losses be parked
3) what could price do now or in the next few days to caused them maximum pain.
For thai bev chart
It look like it is creating a base or support at 0.72 and it is holding well
IF I AM BB, before i continue with my journey, i will sweep both sides
After such a strong impulse down move, who are the ppl in money ? the bears
So i will move the price up so ppl can see 0.72 is a valid support area and join in the buy.
bears who are in profit will see their profits diminish and what will they do to cover position? buy of course.
then next i will push price down to trigger all the stop losses below 0.72 and move so fast they will have to frantically sell to cover their position.
This is the scenario it always happen. and this is the ideal scenario to grab liquidity for both sides.
of course it could just plunge down. it is all about probabilities.
curious_moo ( Date: 04-Mar-2021 14:47) Posted:
|
Unless he is none other than the monkey himself.
bystander1965 ( Date: 04-Mar-2021 13:10) Posted:
|
Bro TikTok...
You mean like this ???
.
You mean like this ???
.
TikTalk ( Date: 04-Mar-2021 11:48) Posted:
|

Look at mamasan weekly chart, from the chart, the supply zone in red scores high. Why ?
Because it creates two down candles and remove all the demand zones on the left.
When it remove demand zone, what did price do actually ? it triggers all the sell stops and grab liquidity. So if you have buy on your way up, and you havent close position, your stop loss will be activated.
Orders need to be pair, 1 sell order = 1 buy order.
1 sell order not pair there will be transaction.
zones that create impulse move that removes opposite zones score high,
there when price do a FTB (first time back), the probability of shorting it is higher.
Look at what price did when it returns to the supply zone?
It reject and create another strong imbalance (gap down)
Gaps are the strongest imbalance ever because it just means there are no orders at the gap which in this case means there are no buy orders at the gap. so if price returns there next time, it will be easy to fill this gap.
Supply and demand are zone to zone trading.
FTB is always high possibilities trades.
As of now, momentum is turning and it seems like price is going to challeng the new imbalance ( the candle before the gap down)
As traders, we let price show us the way and we follow
Oops, i just gotten on board today before your TA.
I entered on daily chart demand zone @0.73. hopefully i can get some short term gains on this.
I entered on daily chart demand zone @0.73. hopefully i can get some short term gains on this.
Kazerin ( Date: 04-Mar-2021 14:34) Posted:
|

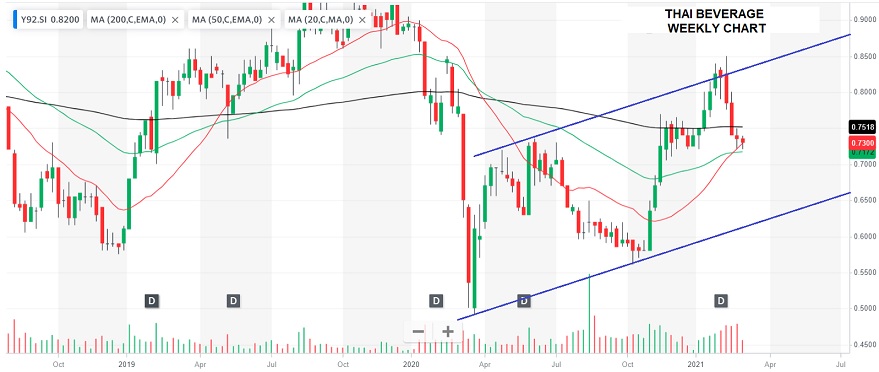
Monthly down trend, weekly uptrend with supply zone in control.
daily is a bullish consolidation, on daily chart in the blue zone where price is now, this is the origin where price breaks its previous high and make another high.
the two zone in grey (0.78 - 0.8) and (0.825-0.85) i will only short when price goes below 0.72 hence remove the blue demand zone and make the two grey zones as valid supply zone. the only area where i will buy is weekly demand zone in blue.
Take a look at the monthly chart, if you short at current price, are you in premium or discount ? are you in a good spot for shorting or a good spot in longing ?
IF you long at 0.60 area, is it a good discount for long ? if you short at 0.8 area, is it a good area for shorts ?
always ask yourself are you getting a discount for long, and are you getting a premium for short and you will be safe.
BeerCo IPO...... . the catalyst.
. the catalyst.SuperLuckyCorn ( Date: 04-Mar-2021 14:05) Posted:
|

1 slice of Bak Kwa needs a 5 km run within 30 mins to burn off ??? I didnt know that. 
Er...
How about 20 mins of ferocious rocking side to side bedminton ? Can ?
Er...
How about 20 mins of ferocious rocking side to side bedminton ? Can ?
bystander1965 ( Date: 04-Mar-2021 13:44) Posted:
|
Me 2, kuai kuai.
bystander1965 ( Date: 04-Mar-2021 13:44) Posted:
|
Chang Beer...Er..birthday gift for adult Chang Beer.
Chang Chang Beer, Ming Chang Chang.
Chang Chang Beer, Ming Chang Chang.
Luzern ( Date: 04-Mar-2021 11:16) Posted:
|
1 piece of bak kwa needs about 5km run in 30min to burn off for an average size person.
Since I don' t run, I kuai kuai have to restrict my intake.
Since I don' t run, I kuai kuai have to restrict my intake.
CheeryVGoh ( Date: 04-Mar-2021 13:28) Posted:
|
STI 3014
TikTalk ( Date: 04-Mar-2021 10:46) Posted:
|
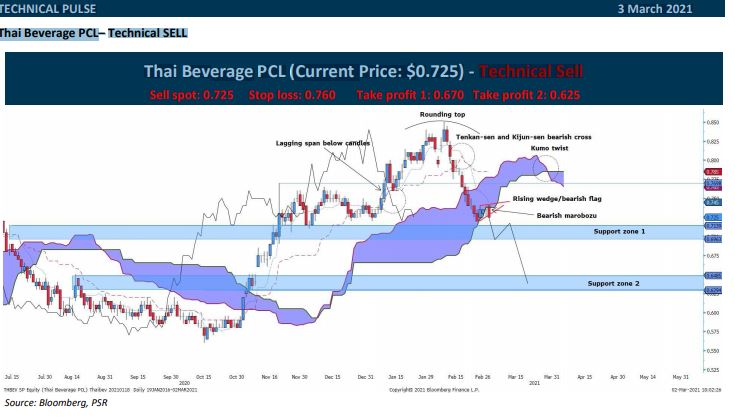
When I saw that picture, I had only one question. There was a support zone 1. Why was the author so sure it would break and go down to zone 2? Then technically was that still a support in the first place? Strange.
I think in his/her mind s/he has already set the direction s/he *thinks* the price would move to.
I think in his/her mind s/he has already set the direction s/he *thinks* the price would move to.
Kazerin ( Date: 04-Mar-2021 13:04) Posted:
|