

kiseki_2818 ( Date: 04-Mar-2021 16:50) Posted:
|
detected gen lucky playing ums now, join him for the fun. 
anyone here playing ums??
anyone here playing ums??
nt so fast ... need see confirmation. lol
wavehunter ( Date: 04-Mar-2021 16:27) Posted:
|
finally moving abit 0.735/0.74
hopefully some more engulfing before EOD.
hopefully some more engulfing before EOD.
wavehunter ( Date: 04-Mar-2021 16:23) Posted:
|
You take the lead but do provide a LEGEND for all your slangs coz I am clueless (and sleepless in SGX) what those words mean. 
rotijai ( Date: 04-Mar-2021 15:54) Posted:
|
Then meantime can we LONG now at 3.18/3.19 to ride her up to the Supply Zone at 3.40 ?
And that' s the one million dollar question.
Which I was hoping that The Kazerin Method can answer.
If can, and hit rate is 60% to 70%... you guys can plan for your early retirement leow.
And that' s the one million dollar question.
Which I was hoping that The Kazerin Method can answer.
If can, and hit rate is 60% to 70%... you guys can plan for your early retirement leow.
curious_moo ( Date: 04-Mar-2021 15:35) Posted:
|
For it to happen, all you need is for Bro Luzern and General Lucky to each unleash their armies to do this chew eh sai leow. 
.

.
TikTalk ( Date: 04-Mar-2021 15:33) Posted:
|
Or also need the monkey according to bro wave
TikTalk ( Date: 04-Mar-2021 15:33) Posted:
|
as per mention in previous post.
We trade first time back only for higher probabilities.
so the chance to short at red supply zone is gone.
Then we see what is price doing now.
Take a moment to see the momentum.
It took about 10 bars from price to leave blue zone to reach red zone.
The rejection was quick and strong (gap down) then candles slow momentum slowing and even become bullish.
for bl00dy 5 weeks price in a tight range.
We dont guess. we see what price is doing and we react accordingly.
The weekly chart create 2 supply zone, zone onto zone. 1st is the one i draw, 2nd is the candle before it gap down.
IF price lets say goes into the supply zone, what do i want to see ?
I want to see supply zone or demand zone being created and i will trade them accordingly.
Demand or supply zone needs to achieve a few things for it to be considered valid.
a strong imbalance isnt a demand or supply zone.
anyway this weekly zone is nested inside the monthly supply zone.
Let me show you the monthly chart and you can see the reaction on supply demand zones and this is what i mean by play ping pong.....
curious_moo ( Date: 04-Mar-2021 15:35) Posted:
|
Ok.......BeerStonk......Diamond Hands. 
rotijai ( Date: 04-Mar-2021 15:54) Posted:
|
can we have more creative names like diamond hands, paper hands, stonks ?
The white ang mo land is really very creative with the WSB' s slang.. lol
it' s funny to watch their GME video clips...
The white ang mo land is really very creative with the WSB' s slang.. lol
it' s funny to watch their GME video clips...
wavehunter ( Date: 04-Mar-2021 15:20) Posted:
|
Im guessing to short with EP and SL based on supply zone near 3.40?
wavehunter ( Date: 04-Mar-2021 15:31) Posted:
|

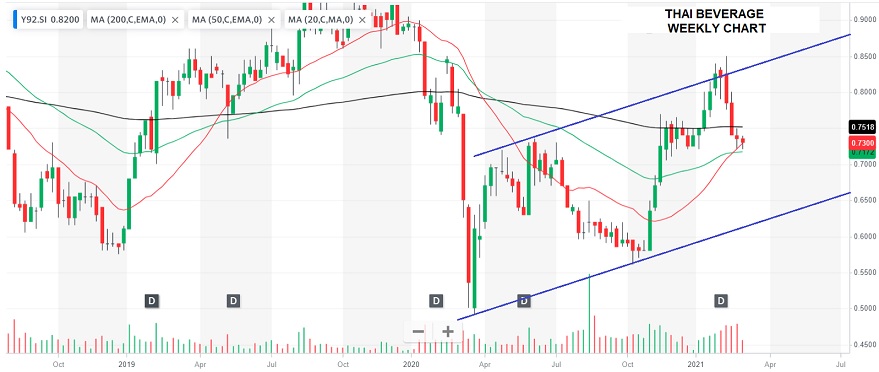
Yes if one can see what I see after rally it corrected to the 3 ma lines just like in May 2019...you see those 3 ma lines are
exactly converging in the same manner in May 2019, thereafter cheong after they cross over.
The red line has crossed over the green if continue rising will cross over the dark ma line.
For it to happen you need the fundamental or the catalyst Luzern mentioned.
exactly converging in the same manner in May 2019, thereafter cheong after they cross over.
The red line has crossed over the green if continue rising will cross over the dark ma line.
For it to happen you need the fundamental or the catalyst Luzern mentioned.
wavehunter ( Date: 04-Mar-2021 14:57) Posted:
|
Professori,
So how do we use this theory to get ahead of the market?
How do we use this teaching to know ahead what the price is likely to do next?
I mean.... if this theory can really help us to see ahead what is going to happen before it happen and if this theory has a hit rate
of say 60% to 70%, then we are all on our way to early retirement. So using this theory, what is Mamasan likely to do next?
Kazerin ( Date: 04-Mar-2021 14:51) Posted:
|