Post Reply
33481-33500 of 38376
Post Reply
33481-33500 of 38376
Fear create opportunity! Only during Fear than we can see this kind of price. Don't miss out! Dyodd
TikTalk ( Date: 05-Mar-2021 17:22) Posted:
Where will I try to buy AR?
If the current down channel continue maybe i will get a chance between 2.85 to 2.89 with at stop at 2.78.
If it doesnt go down there then we relook ok
TikTalk ( Date: 04-Mar-2021 15:23) Posted:
Allow me to kapo on AR
Immediate short term trend is down, see 9ma has been the resistance, 20ma sloping downward, trading below 200m(long trend in question)
thus prices are consolidating ever since the sell off from its high, now we are nearer to lower band of consolidation. Daily MACD and DMI suggest
near term weakness bias. $2.80 critical support(long need to have a stop below this on a closing basis). If support hold then it may either continue to consolidate
between 2.80/85 to 3.12/18 or gradually mover higher and break resistane at 3.12/3.18 can gain upward momentum toward 3.30/3.35 area.
Can trade anot? Why not, if buy below 2.90 with a 10cts risk maybe can make around 15 cts, if break 3.12/3.18 then hosay. But hor you must know
if you buying for short term or long term, and always have exit plan otherwise can become wrong term hor.
I will just trade within those range mentioned above if I want to be involve in AR. No need to care up or down trend. Only care if you make or lose buying
or selling...hehehetiktalk again.
|
|
|
|
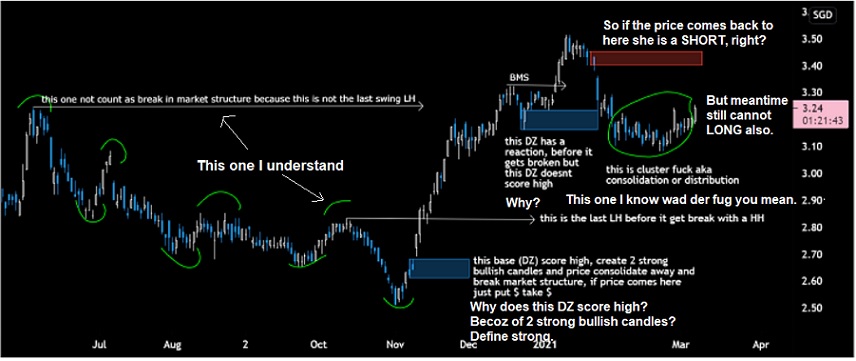
See this eg of how price leave the zone. It paused for 4 candles to create the base before that few strong bullish candles
This is the kind of imbalance you want to trade on your charts.
Ppl say price can do three things, up down and sideways.
In supply demand terms, price can do four things
Rally base rally, rally base drop, drop base drop, drop base rally.
You can read more about supply demand by googling
Supply and Demand Basic Forex Stocks Trading Nutshell by Alfonso Moreno
He is a wonderful mentor for supply demand trading.
The first person that teach it is sam seiden (but kana caught for criminal fraud)
Subsequently, a few courses teach that.
RTM , read the market is one of them (very confusing)
I3T3 by this indian Ashok who learn from RTM and simplified it
Set and forget by alfonso moreno , he has a rule based system so there is no discretionary
ICT is a mixture but he label demand supply zone as order blocks and he teaches smart money concepts
He did create alot of monster in forex and last year there were so many smc courses
For all those that want stress free trading and following simple rules, can learn set and forget from alfonso.
Can read his pdf first to know more.
Or you can msg me i have the basic of his course.
Kazerin ( Date: 05-Mar-2021 10:14) Posted:

Sharing the only trade i took it this week based on HTF POI (point of interest) with LTF entries
EURGBP is in a downtrend, i use the trendline as a guide, not part of my system. the green curve lines are swing highs or swing lows.
Surprisingly, alot of people struggle with market structure. Will get to that later
Now price break market structure (BMS) with a higher high , so we mark out the demand zone with imbalance that took out this lower high
Imbalance - huge bullish or bearish candles, before that will be the base where the price is balance and the fighting took place
So now, we wait for price to retrace back to the demand zone prior to the up move.

So now price came back into our demand zone, what we want to see is a shift in momentum.
How, by breaking lower highs. from the above M1 chart, price makes a impulse move and breaks market structure. after that, we place a limit order to wait price to fill us in. As it was late last night and i cannot do market execution, i had my stop loss at 5 pips with my first TP at 40 pips for a 1:8 trade
Currently running 1:3
By using market structure only, we can know what is happening in the market.
Hope this helps
|
|
If the price goes to the red zone, that is a good chance to short
BUT we need confirmation
Arrival into zone , is it a strong arrival into a zone with big strong bullish candles and leaving a strong base behind or is
It slowly inching climbing to the supply zone?
I forgot hw the HTF looks like so will need to see that as well if that happens
Looking at the whole pic, it seems that it will slowly grind down
Scoring of a zone requires three components
How did price leave the zone or as we call the strength of departure.
That blue zone didnt score high because price leave the zone and test it very quickly hence the zone is not fresh.
Remember my eg that we only trade the first time back of a zone.
It already tested the zones on the way up so any pending orders have already been mitigated.
So when the price returns, it is not a high probability trade and most likely the zone will be removed
Compare this blue zone and my eg this morning on EURGBP
See the difference of how price leave the zone.
wavehunter ( Date: 05-Mar-2021 17:07) Posted:
Noolah.
I think what the Professori mean is......the price is consolidating now but whether it is accumulation or distribution is unknown
and requires confirmation. But therein lies the problem. By the time we get confirmation and the direction is very clear on the
chart, it may also mean we are nearing the end of that move. So if we open a trade when that direction is confirmed, if it is
the end of that move, we become stuck. We will need a continuation of that move...to profit from making a trade there.
rotijai ( Date: 05-Mar-2021 16:56) Posted:
let me try to explain the " I (dont) know wad der fug you mean" ...
This is the last lower high before it got broken by trend reversal with a higher high |
|
|
|
Where will I try to buy AR?
If the current down channel continue maybe i will get a chance between 2.85 to 2.89 with at stop at 2.78.
If it doesnt go down there then we relook ok
TikTalk ( Date: 04-Mar-2021 15:23) Posted:
Allow me to kapo on AR
Immediate short term trend is down, see 9ma has been the resistance, 20ma sloping downward, trading below 200m(long trend in question)
thus prices are consolidating ever since the sell off from its high, now we are nearer to lower band of consolidation. Daily MACD and DMI suggest
near term weakness bias. $2.80 critical support(long need to have a stop below this on a closing basis). If support hold then it may either continue to consolidate
between 2.80/85 to 3.12/18 or gradually mover higher and break resistane at 3.12/3.18 can gain upward momentum toward 3.30/3.35 area.
Can trade anot? Why not, if buy below 2.90 with a 10cts risk maybe can make around 15 cts, if break 3.12/3.18 then hosay. But hor you must know
if you buying for short term or long term, and always have exit plan otherwise can become wrong term hor.
I will just trade within those range mentioned above if I want to be involve in AR. No need to care up or down trend. Only care if you make or lose buying
or selling...hehehetiktalk again.
|
|
Noolah.
I think what the Professori mean is......the price is consolidating now but whether it is accumulation or distribution is unknown
and requires confirmation. But therein lies the problem. By the time we get confirmation and the direction is very clear on the
chart, it may also mean we are nearing the end of that move. So if we open a trade when that direction is confirmed, if it is
the end of that move, we become stuck. We will need a continuation of that move...to profit from making a trade there.
rotijai ( Date: 05-Mar-2021 16:56) Posted:
let me try to explain the " I (dont) know wad der fug you mean" ...
This is the last lower high before it got broken by trend reversal with a higher high.
wavehunter ( Date: 05-Mar-2021 16:50) Posted:
|
|
|
I will do this with Ascendas to illustrate my point.
You can do the same with your chosen stock.
For Ascendas... today we saw price range at 2.91 to 2.95.
In the course of today, we saw the price touched Day Low at 2.91 and after that she traded up to 2.94 : 2.95 which is a good 4 bids
above the Day Low of 2.91. But the price is now back at 2.92 : 2.93. When this happens, just ask ourselves what must there be before
this can happen. Selling. There must still be people willing to sell before the price can lose ground from 2.94 : 2.95 to go back to 2.92 : 2.93.
Meaning there is still selling going on. The selling is not done yet. Becoz if the selling is done, if there is no one left who is willing to sell at
below 2.94 when the price was doing 2.94 : 2.95, we will see the price edge up to 2.95 : 2.96 when sellers at 2.95 have dried up and only
sellers at 2.96 can be found with no more sellers at 2.95 left. But if the selling is not done...if there are still people willing to sell at 2.93 and
lower, we will see the price edging lower when buyers at 2.94 dries up and then even lower when buyers at 2.93 dries up and so on. And
for as long as there are still people selling, 2.91 will eventually dry up as well and that' s when we see 2.90. And so on. So long as there is
still selling, the bottom isn' t reached yet. That being the case, why buy now. I should wait. I should wait for sellers to dry up first.
let me try to explain the " I (dont) know wad der fug you mean" ...
This is the last lower high before it got broken by trend reversal with a higher high.
wavehunter ( Date: 05-Mar-2021 16:50) Posted:
|
beers slowly inch up, think 2 gen (gen luzern and gen lucky) joined forces more power.
now inviting other gen to join in.
gen ken, ah mah, uncle wave, bro kazerin, curious moo, ..fri night coming.let' s have beers party
In which case we need to look no further other than our Golden Goose' s thread.
If he says BUY THIS BUY THAT.... it means that long awaited correction is finally here.
I cant visit the goose' s FB page becoz he blocked me.
Can one of you please do the honour. Thank you.
rotijai ( Date: 05-Mar-2021 16:15) Posted:
i think most of us expect the music to stop soon...
but are still jumping in and out or holding as long as possible until the last second of the music.. hoping to get the right timing of once you sell market crashes...
lol... |
|
Anybody here understands fully what the Professori said and can explain to me all over again?
Thank you.
I am all ears.
Kazerin ( Date: 05-Mar-2021 16:06) Posted:

Market structure means you need to mark out each swing points
from left we have the LH, LL, LH ,LL and market structure momentum POTENTIAL change when LH is broken with a HH and HL and if this HH gets broken , confirm momentum change cause we have create two swing points.
wavehunter ( Date: 05-Mar-2021 15:33) Posted:
Prof Kazerin,
NOW WHAT ???
.
 |
|
|
|
i think most of us expect the music to stop soon...
but are still jumping in and out or holding as long as possible until the last second of the music.. hoping to get the right timing of once you sell market crashes...
lol...
anyway i just scare through my sg stocks chart,
ums $1 and sats $3.93 can tikam long
dyodd and good luck
Market structure means you need to mark out each swing points
from left we have the LH, LL, LH ,LL and market structure momentum POTENTIAL change when LH is broken with a HH and HL and if this HH gets broken , confirm momentum change cause we have create two swing points.
wavehunter ( Date: 05-Mar-2021 15:33) Posted:
Prof Kazerin,
NOW WHAT ???
.
|
|
i a bit scare of gahment hammer, although unlikely, but when really hammer, think everything upside down.
wavehunter ( Date: 05-Mar-2021 15:33) Posted:
Prof Kazerin,
NOW WHAT ???
.
|
|
Prof Kazerin,
NOW WHAT ???
.
ums, singtel, dots, beers...the 4 beauty that i smell lucky smell.
kiseki_2818 ( Date: 05-Mar-2021 14:11) Posted:
ums, singtel, dots, beers...the 4 beauty, lai lai all come to uncle wave & my bed.
short or long, which one u like.
wan short long long, may need to find uncle wave.
i long short short.
|
|
ums, singtel, dots, beers...the 4 beauty, lai lai all come to uncle wave & my bed.
short or long, which one u like.
wan short long long, may need to find uncle wave.
i long short short.
Bro Wave,
Noted with thanks.
:)
wavehunter ( Date: 05-Mar-2021 13:27) Posted:
No it wont.
Reduce quantity can.
Increase cannot.
CheeryVGoh ( Date: 05-Mar-2021 13:14) Posted:
| If I amend the qty under my buy Q without changing the price, will my Q order be pushed further down the Q? |
|
|
|