ya, hope general lucky dont sell at 3.10 then i can upgrade from starbucks to gourmet kopi.
wavehunter ( Date: 18-Mar-2021 08:48) Posted:
|
Ascendas...
We saw 3.08 yesterday.
Will we see 3.10 today?
General Lucky... please dont sell at 3.10.
Let the bulls run undisturbed.
Dont disrupt their upward momentum, please.
Thanks.
We saw 3.08 yesterday.
Will we see 3.10 today?
General Lucky... please dont sell at 3.10.
Let the bulls run undisturbed.
Dont disrupt their upward momentum, please.
Thanks.
Dow closed +189.
Futures +100
Futures +100
PS - prelimary supp, SC - selling climax, AR - automatic rally, STA - secondary test in phase A, Choch - change of character the rest i word out liao. 
wavehunter ( Date: 17-Mar-2021 21:44) Posted:
|
ep 54, sl 50, weekly demand zone
wavehunter ( Date: 17-Mar-2021 22:37) Posted:
|

Professori,
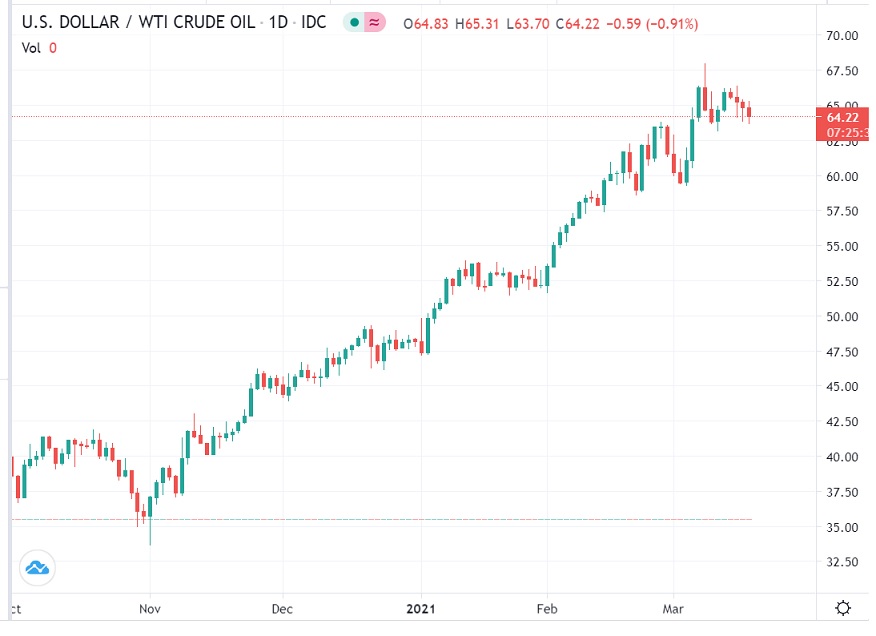
This is WTI Crude Oil Daily chart.
How to play?
You may want to use the chart from this site instead.
.
http://www.macrotrends.net/2566/crude-oil-prices-today-live-chart

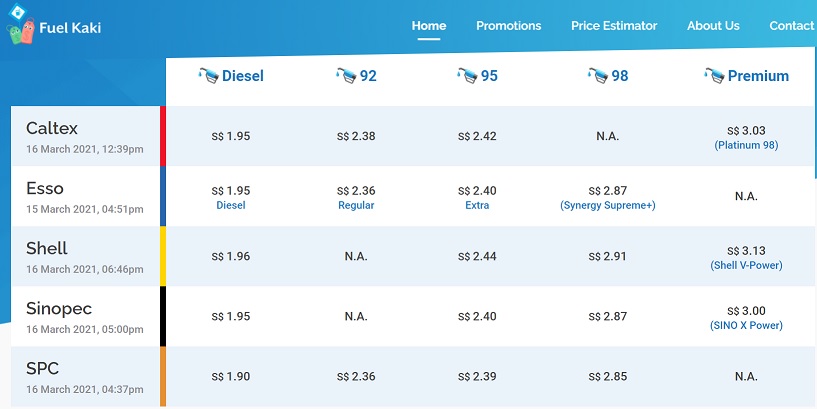
95 Octane petrol was at $2.02 for a very long time 2 months ago.
Suddenly Oil price shot up from minus value to $64 per barrel and at the same time Ah Keat increase petrol duty by 10 cts to encourage us
to dump our petrol powered cars now and switch to electric cars. But how to switch now ? Switch already most of us will be pushing our cars
around and parking them, not driving them. So this increase of 10 cts in petrol duty per litre to encourage us to switch to EVs is utter nonsense.
How to own EVs now when there are no charging points in my car park? In fact, there isn' t any charging point within a 3 km radius from where
I live. Even our bros and siss who live in landed properties and can have their own charging points in their driveway are not thinking of switching
to EVs. What more of those who have to grapple with finding charging points? By the way, a charging point is a fire hazard, correct ? Which may
explain why many landed property owners may not want to install a charging point in their driveway.   
How to deal with the price of petrol tiam tiam go up har?
Go LONG in Oil ?   


Anybody here knows what those abbreviations stand for?
Thanks hor. 
I think tonite' s Fed meeting will be a non-event.
No reaction from the market is what I think will be the case.
Which means market will continue to do what it has been doing - Tango...Cry Woof !!! ... more Tango... followed by Woof !!! Woof !!! again. Etc. 
End up those who dare to buy the dips will see the market edge up higher and higher and those who remain at the sidelines will miss the boat. 
Right decision.
TikTalk ( Date: 17-Mar-2021 19:41) Posted:
|
Bro wave, 
I did not only sold AR but a few other stocks just taking some chips off the table ahead of tonights meeting.
Reducing my total holdings by 25%.
 
I did not only sold AR but a few other stocks just taking some chips off the table ahead of tonights meeting.
Reducing my total holdings by 25%.
 
wavehunter ( Date: 17-Mar-2021 16:15) Posted:
|

Ascendas chart.
It is in monthly demand zone and also in weekly supply zone.
We can see the SC and AR nicely play out. That upwave on AR is super strong but did it continue ? no. It is also low volume which satisfy the AR. Look at effort and cause and the speed of the AR. ChoCh (change of character), after a long downtrend we can expect this when it hits monthly demand zone. 
Take a look at the price action at phase B (Creek) and Spring. What is the difference? Spring, after Stop hunt and testing SC it got a huge reaction to the upside but hit weekly supply zone and slowing down.
What to look for. In wyckoff schematics, we have to wait for the schematics to full form. After spring, we should have a low volume test ( at the blue zone) before price move up again. (Phase C) 
In Phase D, we should see SOS (sign of strength) price should do a Jump over creek before pulling back to create a LPS (last pt of supp) 
Point of entry, the old school wyckoffians will wait for the schematics to FULLY form and enter at Last point of support because that will be the start of the marked up phase.
recently, many new traders will take a risky entry at Secondary test ( blue zone) cause the risk to reward is higher. 
As i said, the schematic is not fully form until fully form so be patient. But whatever you do, dont get caught between the AR and SC range. Rather sell at AR, Buy at SC you will have much higher chance to get out. 
dont buy or sell in the middle then you hanging no where. Just my opinion. 
The Wyckoff Method involves a five-step approach to stock selection and trade entry, which can be summarized as follows:
A Five-Step Approach to the Market
1. Determine the present position and probable future trend of the market. Is the market consolidating or trending? Does your analysis of market structure, supply and demand indicate the direction that is likely in the near future? This assessment should help you decide whether to be in the market at all and, if so, whether to take long or short positions. Use both bar charts and Point and Figure charts of the major market indices for Step 1.
2.  Select stocks in harmony with the trend. In an uptrend, select stocks that are stronger than the market. For instance, look for stocks that demonstrate greater percentage increases than the market during rallies and smaller decreases during reactions. In a downtrend, do the reverse &ndash choose stocks that are weaker than the market. If you are not sure about a specific issue, drop it and move on to the next one. Use bar charts of individual stocks to compare with those of the most relevant market index for Step 2.
3. Select stocks with a &ldquo cause&rdquo that equals or exceeds your minimum objective. A critical component of Wyckoff' s trade selection and management was his unique method of identifying price targets using Point and Figure (P& F) projections for both long and short trades. In Wyckoff' s fundamental law of &ldquo Cause and Effect,&rdquo the horizontal P& F count within a trading range represents the cause, while the subsequent price movement represents the effect. Therefore, if you are planning to take long positions, choose stocks that are under accumulation or re-accumulation and have built a sufficient cause to satisfy your objective. Step 3 relies on the use of Point and Figure charts of individual stocks.
4. Determine the stocks' readiness to move. Apply the nine tests for buying or for selling (described below). For instance, in a trading range after a prolonged rally, does the evidence from the nine selling tests suggest that significant supply is entering the market and that a short position may be warranted? Or in an apparent accumulation trading range, do the nine buying tests indicate that supply has been successfully absorbed, as evidenced further by a low-volume spring and an even lower-volume test of that spring? Use bar charts and Point and Figure charts of individual stocks for Step 4.
5. Time your commitment with a turn in the stock market index. Three-quarters or more of individual issues move in harmony with the general market, so you improve the odds of a successful trade by having the power of the overall market behind it. Specific Wyckoff principles help you anticipate potential market turns, including a change of character of price action (such as the largest down-bar on the highest volume after a long uptrend), as well as manifestations of Wyckoff' s three laws (see below). Put your stop-loss in place and then trail it, as appropriate, until you close out the position. Use bar and Point and Figure charts for Step 5. 
--------------------------------------------------------------
If you like what you have read so far and you want to know more, you will have to read the whole article.
http://www.wyckoffanalytics.com/wp-content/uploads/2020/05/Wyckoff-Method_Wyckoff-Analytics_english.pdf
Bro,
Phillips revised BUY call to NEUTRAL on 10/03 with TP : 0.156 (Previous 0.34)
See if price goes down much lower than 0.156, then decide.
Cheers !
Phillips revised BUY call to NEUTRAL on 10/03 with TP : 0.156 (Previous 0.34)
See if price goes down much lower than 0.156, then decide.
Cheers !
fatpanda ( Date: 17-Mar-2021 15:52) Posted:
|
This trade was meant for a quick cup of kopi. See whether the monkey want to brew me a cup of ikea kopi, starbucks or gourmet kopi.
wavehunter ( Date: 17-Mar-2021 14:26) Posted:
|
Ascendas...
To buy or not to buy the current dip..... that is the question for those looking to buy or to add.
JYOB. 
To buy or not to buy the current dip..... that is the question for those looking to buy or to add.
JYOB. 
They do buy and sell becoz when a stock is rising, they also sell on the way up.
They dont push and push and wait until the price has reached the top before they start selling.
Monkeys all dont do that. Monkeys all sell on the way up.
Peter Lim, our king remisier said in an interview...
" You must sell when the market is rising...when there are still buyers.
You cannot wait until the market has turned, to sell. There will be no buyers left."
Brownbear ( Date: 17-Mar-2021 16:51) Posted:
|
Bro,
People got " CFA" leh... Qualified professional lah. Give some face please. 
wavehunter ( Date: 17-Mar-2021 16:43) Posted:
|


