 Post Reply
321-340 of 421
Post Reply
321-340 of 421
Hit R1 today. May have to wiat for next monday to see if ISDN can hit R2.
Still hovering above the upper bound of the channel.
So far, short term uptrend still intact. No sign of reversal yet.
JurongW ( Date: 16-Apr-2026 17:26) Posted:
Looks good as price close above the descending channel today at 41
R1: 42.5
R2: 43.5 |
|
Let's hope your technical reading will be self fulfilling in due course.
Thks
JurongW ( Date: 16-Apr-2026 17:26) Posted:
Looks good as price close above the descending channel today at 41
R1: 42.5
R2: 43.5 |
|
Looks good as price close above the descending channel today at 41
R1: 42.5
R2: 43.5
TECHNICAL ANALYSIS OF ISDN AS ON 16TH APRIL 2026
A) Daily Short Term Pivot Support Close at 0.37.
B) End Weekly Intermediate Term Pivot Support Close at 0.35.
C) End Monthly Long Term Pivot Support Close at 0.27.
TECHNICAL SYNOPSIS
As long as ISDN Daily Short Term Pivot Support Close at 0.37 is not violated to date, its daily price action may have the potential to grind up higher to test its previous high of 0.435 and possibly breaking above it.
Breaking and closing below its Daily Short Term Pivot Support Close at 0.37, may portend ISDN daily price action to test its End Weekly Intermediate Pivot Support Close at 0.35.
As long as ISDN does not close below its End Weekly Intermediate Support Close at 0.35, there is a high probability that the most recent low of 0.335 may be well supported and becomes its consolidated low to date.
But if ISDN closes below its End Weekly Intermediate Pivot Support Close at 0.35, its price action may potentially break its most recent support low of 0.335 and test its downside of its End Monthly Long Term Pivot Support Close at 0.27.
Closing below 0.27 may portend very much lower price action.
Due diligence is warranted.
TECHNICAL ANALYSIS OF ISDN AS ON 15TH APRIL 2026
A) Daily Short Term Pivot Support Close at 0.37.
B) End Weekly Intermediate Term Pivot Support Close at 0.35.
C) End Monthly Long Term Pivot Support Close at 0.27.
TECHNICAL SYNOPSIS
As long as ISDN Daily Short Term Pivot Support Close at 0.37 is not violated to date, its daily price action may have the potential to grind up higher to test its previous high of 0.435 and possibly breaking above it.
Breaking and closing below its Daily Short Term Pivot Support Close at 0.37, may portend ISDN daily price action to test its End Weekly Intermediate Pivot Support Close at 0.35.
As long as ISDN does not close below its End Weekly Intermediate Support Close at 0.35, there is a high probability that the most recent low of 0.335 may be well supported and becomes its consolidated low to date.
But if ISDN closes below its End Weekly Intermediate Pivot Support Close at 0.35, its price action may potentially break its most recent support low of 0.335 and test its downside of its End Monthly Long Term Pivot Support Close at 0.27.
Closing below 0.27 may portend very much lower price action.
Due diligence is warranted.
TECHNICAL ANALYSIS OF ISDN AS ON 14TH APRIL 2026
A) Daily Short Term Pivot Support Close at 0.37.
B) End Weekly Intermediate Term Pivot Support Close at 0.35.
C) End Monthly Long Term Pivot Support Close at 0.27.
TECHNICAL SYNOPSIS
As long as ISDN Daily Short Term Pivot Support Close at 0.37 is not violated to date, its daily price action may have the potential to grind up higher to test its previous high of 0.435 and possibly breaking above it.
Breaking and closing below its Daily Short Term Pivot Support Close at 0.37, may portend ISDN daily price action to test its End Weekly Intermediate Pivot Support Close at 0.35.
As long as ISDN does not close below its End Weekly Intermediate Support Close at 0.35, there is a high probability that the most recent low of 0.335 may be well supported and becomes its consolidated low to date.
But if ISDN closes below its End Weekly Intermediate Pivot Support Close at 0.35, its price action may potentially break its most recent support low of 0.335 and test its downside of its End Monthly Long Term Pivot Support Close at 0.27.
Closing below 0.27 may portend very much lower price action.
Due diligence is warranted.
TECHNICAL ANALYSIS OF ISDN AS ON 13TH APRIL 2026
A) Daily Short Term Pivot Support Close at 0.37.
B) End Weekly Intermediate Term Pivot Support Close at 0.35.
C) End Monthly Long Term Pivot Support Close at 0.27.
TECHNICAL SYNOPSIS
As long as ISDN Daily Short Term Pivot Support Close at 0.37 is not violated to date, its daily price action may have the potential to grind up higher to test its previous high of 0.435 and possibly breaking above it.
Breaking and closing below its Daily Short Term Pivot Support Close at 0.37, may portend ISDN daily price action to test its End Weekly Intermediate Pivot Support Close at 0.35.
As long as ISDN does not close below its End Weekly Intermediate Support Close at 0.35, there is a high probability that the most recent low of 0.335 may be well supported and becomes its consolidated low to date.
But if ISDN closes below its End Weekly Intermediate Pivot Support Close at 0.35, its price action may potentially break its most recent support low of 0.335 and test its downside of its End Monthly Long Term Pivot Support Close at 0.27.
Closing below 0.27 may portend very much lower price action.
Due diligence is warranted.
TECHNICAL ANALYSIS OF ISDN AS ON 10TH APRIL 2026
A) Daily Short Term Pivot Support Close at 0.37.
B) End Weekly Intermediate Term Pivot Support Close at 0.35.
C) End Monthly Long Term Pivot Support Close at 0.27.
TECHNICAL SYNOPSIS
As long as ISDN Daily Short Term Pivot Support Close at 0.37 is not violated to date, its daily price action may have the potential to grind up higher to test its previous high of 0.435 and possibly breaking above it.
Breaking and closing below its Daily Short Term Pivot Support Close at 0.37, may portend ISDN daily price action to test its End Weekly Intermediate Pivot Support Close at 0.35.
As long as ISDN does not close below its End Weekly Intermediate Support Close at 0.35, there is a high probability that the most recent low of 0.335 may be well supported and becomes its consolidated low to date.
But if ISDN closes below its End Weekly Intermediate Pivot Support Close at 0.35, its price action may potentially break its most recent support low of 0.335 and test its downside of its End Monthly Long Term Pivot Support Close at 0.27.
Closing below 0.27 may portend very much lower price action.
Due diligence is warranted.
Hopefully your target will be achieved.
PQTPQK ( Date: 09-Apr-2026 21:31) Posted:
Should test 0.43 tomorrow...?
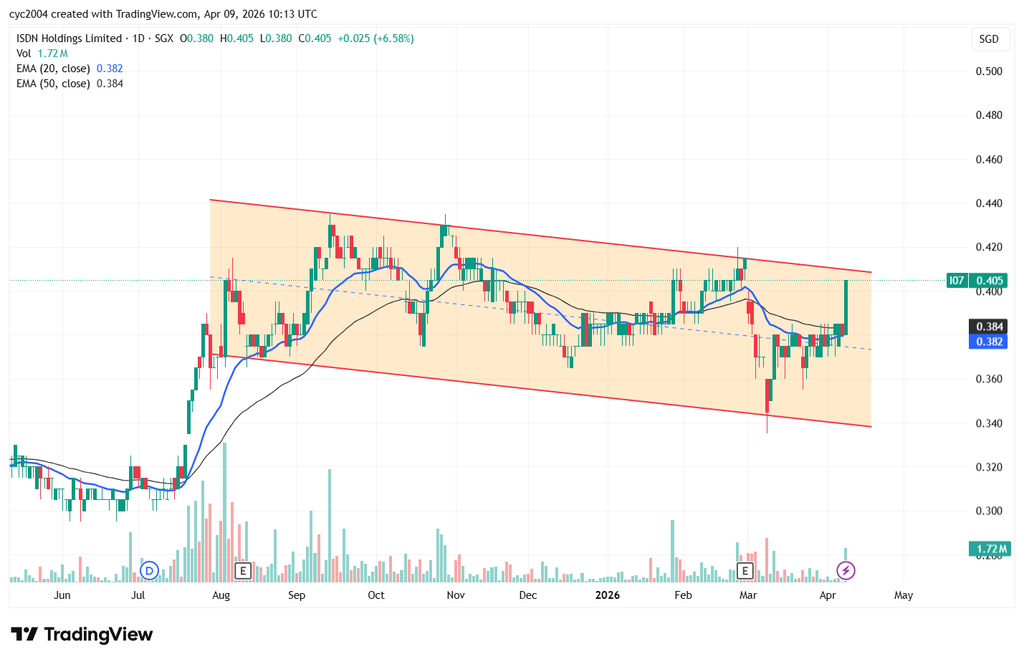
JurongW ( Date: 09-Apr-2026 18:16) Posted:
Pending breakout from descending channel or will it hit the upper bound of the channel and move down?
 |
|
|
|
1st resistance at 42 if it rallies with strength tomorrow, but who knows you maybe right 
PQTPQK ( Date: 09-Apr-2026 21:31) Posted:
Should test 0.43 tomorrow...?
JurongW ( Date: 09-Apr-2026 18:16) Posted:
Pending breakout from descending channel or will it hit the upper bound of the channel and move down?
|
|
|
|
Should test 0.43 tomorrow...?
JurongW ( Date: 09-Apr-2026 18:16) Posted:
Pending breakout from descending channel or will it hit the upper bound of the channel and move down?
|
|
Pending breakout from descending channel or will it hit the upper bound of the channel and move down?
TECHNICAL ANALYSIS OF ISDN AS ON 9TH APRIL 2026
A) Daily Short Term Pivot Resistance Close at 0.39.
B) End Weekly Intermediate Term Pivot Support Close at 0.35.
C) End Monthly Long Term Pivot Support Close at 0.27.
TECHNICAL SYNOPSIS
With ISDN having closed above its Daily Pivot Resistance of 0.39 at 0.405, its daily price action may have the potential to grind up higher to test its previous high of 0.435 and possibly breaking above it as long its New Surfacing Pivot Support Close at 0.355 is not violated to date.
Breaking below its Daily Pivot Support at 0.355, may portend ISDN daily price action to test its End Weekly Intermediate Pivot Support at 0.35.
As long as ISDN could not close below End Weekly Support at 0.35, there is a high probability that the most recent low of 0.335 may be well supported and becomes its consolidated low to date.
But if ISDN closes below its End Weekly Intermediate Pivot Support at 0.35, its price action may potentially break its most recent support low of 0.335 and test its downside of its End Monthly Long Term Pivot Support at 0.27.
Closing below 0.27 may portend very much lower price action.
Due diligence is warranted.
TECHNICAL ANALYSIS OF ISDN AS ON 8TH APRIL 2026
A) Daily Short Term Pivot Resistance Close at 0.39.
B) End Weekly Intermediate Term Pivot Support Close at 0.35.
C) End Monthly Long Term Pivot Support Close at 0.27.
TECHNICAL SYNOPSIS
As long as ISDN daily
price action maintains below its Daily Pivot Resistance at 0.39 to date, its price action still has the potential to retest the downside of its End Weekly Intermediate Support Close at 0.35 which has even violated to touch its most recent daily low lof 0.335 before staging a rebound to date.
As long as ISDN daily price action does not close below End Weekly Intermediate Close of 0.35, ISDN might still stage a rebound in due course but if any End Weekly Close of 0.35 surfaces, ISDN may still grind down lower to retest recent low of 0.335.
As long as ISDN could not close below End Weekly Support at 0.35, there is a high probability that the most recent low of 0.335 may be well supported and becomes its consolidated low to date.
If ISDN can close above its Daily Pivot Resistance at 0.39 in due course, its daily price action may have the potential to grind up higher portending a New Daily Pivot Support to surface.
But if ISDN closes below its Intermediate Pivot Support at 0.35 any Week End, its price action may potentially break its recent support low of 0.335 and test its downside of its End Monthly Long Term Pivot Support at 0.27.
Closing below 0.27 may portend very much lower price action.
Due diligence is warranted.
TECHNICAL ANALYSIS OF ISDN AS ON 7TH APRIL 2026
A) Daily Short Term Pivot Resistance Close at 0.39.
B) End Weekly Intermediate Term Pivot Support Close at 0.35.
C) End Monthly Long Term Pivot Support Close at 0.27.
TECHNICAL SYNOPSIS
As long as ISDN daily
price action maintains below its Daily Pivot Resistance at 0.39 to date, its price action still has the potential to retest the downside of its End Weekly Intermediate Support Close at 0.35 which has even violated to touch its most recent daily low lof 0.335 before staging a rebound to date.
As long as ISDN daily price action does not close below End Weekly Intermediate Close of 0.35, ISDN might still stage a rebound in due course but if any End Weekly Close of 0.35 surfaces, ISDN may still grind down lower to retest recent low of 0.335.
As long as ISDN could not close below End Weekly Support at 0.35, there is a high probability that the most recent low of 0.335 may be well supported and becomes its consolidated low to date.
If ISDN can close above its Daily Pivot Resistance at 0.39 in due course, its daily price action may have the potential to grind up higher portending a New Daily Pivot Support to surface.
But if ISDN closes below its Intermediate Pivot Support at 0.35 any Week End, its price action may potentially break its recent support low of 0.335 and test its downside of its End Monthly Long Term Pivot Support at 0.27.
Closing below 0.27 may portend very much lower price action.
Due diligence is warranted.
TECHNICAL ANALYSIS OF ISDN AS ON 6TH APRIL 2026
A) Daily Short Term Pivot Resistance Close at 0.39.
B) End Weekly Intermediate Term Pivot Support Close at 0.35.
C) End Monthly Long Term Pivot Support Close at 0.27.
TECHNICAL SYNOPSIS
As long as ISDN daily
price action maintains below its Daily Pivot Resistance at 0.39 to date, its price action still has the potential to retest the downside of its End Weekly Intermediate Support Close at 0.35 which has even violated to touch its most recent daily low lof 0.335 before staging a rebound to date.
As long as ISDN daily price action does not close below End Weekly Intermediate Close of 0.35, ISDN might still stage a rebound in due course but if any End Weekly Close of 0.35 surfaces, ISDN may still grind down lower to retest recent low of 0.335.
As long as ISDN could not close below End Weekly Support at 0.35, there is a high probability that the most recent low of 0.335 may be well supported and becomes its consolidated low to date.
If ISDN can close above its Daily Pivot Resistance at 0.39 in due course, its daily price action may have the potential to grind up higher portending a New Daily Pivot Support to surface.
But if ISDN closes below its Intermediate Pivot Support at 0.35 any Week End, its price action may potentially break its recent support low of 0.335 and test its downside of its End Monthly Long Term Pivot Support at 0.27.
Closing below 0.27 may portend very much lower price action.
Due diligence is warranted.
Thanks
JurongW ( Date: 02-Apr-2026 17:51) Posted:

baicho ( Date: 02-Apr-2026 17:05) Posted:
| Impossible for me to be the only one investing in this stock. My dollar cost average for this particular stock is about 0.55. Still underwater. But I still have time on my side to keep holding my stock. |
|
|
|
baicho ( Date: 02-Apr-2026 17:05) Posted:
Impossible for me to be the only one investing in this stock. My dollar cost average for this particular stock is about 0.55. Still underwater. But I still have time on my side to keep holding my stock.
JurongW ( Date: 02-Apr-2026 16:54) Posted:
| Think you are the only one trading this stock. You bought at what price? |
|
|
|
Impossible for me to be the only one investing in this stock. My dollar cost average for this particular stock is about 0.55. Still underwater. But I still have time on my side to keep holding my stock.
JurongW ( Date: 02-Apr-2026 16:54) Posted:
Think you are the only one trading this stock. You bought at what price?
baicho ( Date: 02-Apr-2026 16:46) Posted:
| TECHNICAL ANALYSIS OF ISDN AS ON 2ND APRIL 2026
A) Daily Short Term Pivot Resistance Close at 0.39.
B) End Weekly Intermediate Term Pivot Support Close at 0.35.
C) End Monthly Long Term Pivot Support Close at 0.27.
TECHNICAL SYNOPSIS
As long as ISDN daily
price action maintains below its Daily Pivot Resistance at 0.39 to date, its price action still has the potential to retest the downside of its End Weekly Intermediate Support Close at 0.35 which has even violated to touch its most recent daily low lof 0.335 before staging a rebound to date.
As long as ISDN daily price action does not close below End Weekly Intermediate Close of 0.35, ISDN might still stage a rebound in due course but if any End Weekly Close of 0.35 surfaces, ISDN may still grind down lower to retest recent low of 0.335.
As long as ISDN could not close below End Weekly Support at 0.35, there is a high probability that the most recent low of 0.335 may be well supported and becomes its consolidated low to date.
If ISDN can close above its Daily Pivot Resistance at 0.39 in due course, its daily price action may have the potential to grind up higher portending a New Daily Pivot Support to surface.
But if ISDN closes below its Intermediate Pivot Support at 0.35 any Week End, its price action may potentially break its recent support low of 0.335 and test its downside of its End Monthly Long Term Pivot Support at 0.27.
Closing below 0.27 may portend very much lower price action.
Due diligence is warranted. |
|
|
|
Think you are the only one trading this stock. You bought at what price?baicho ( Date: 02-Apr-2026 16:46) Posted:
| TECHNICAL ANALYSIS OF ISDN AS ON 2ND APRIL 2026
A) Daily Short Term Pivot Resistance Close at 0.39.
B) End Weekly Intermediate Term Pivot Support Close at 0.35.
C) End Monthly Long Term Pivot Support Close at 0.27.
TECHNICAL SYNOPSIS
As long as ISDN daily
price action maintains below its Daily Pivot Resistance at 0.39 to date, its price action still has the potential to retest the downside of its End Weekly Intermediate Support Close at 0.35 which has even violated to touch its most recent daily low lof 0.335 before staging a rebound to date.
As long as ISDN daily price action does not close below End Weekly Intermediate Close of 0.35, ISDN might still stage a rebound in due course but if any End Weekly Close of 0.35 surfaces, ISDN may still grind down lower to retest recent low of 0.335.
As long as ISDN could not close below End Weekly Support at 0.35, there is a high probability that the most recent low of 0.335 may be well supported and becomes its consolidated low to date.
If ISDN can close above its Daily Pivot Resistance at 0.39 in due course, its daily price action may have the potential to grind up higher portending a New Daily Pivot Support to surface.
But if ISDN closes below its Intermediate Pivot Support at 0.35 any Week End, its price action may potentially break its recent support low of 0.335 and test its downside of its End Monthly Long Term Pivot Support at 0.27.
Closing below 0.27 may portend very much lower price action.
Due diligence is warranted. |
|
