I shared my trades on SGX and SCI just because I bought this two again last Friday, I do have other
stocks that I felt I didnt do too well which I may share in the near future.
Those recent trade leads to this sharing of short-term trading vs buy & hold position tradings.
See my yells " Timing the market Vs Time In The Market"
You will find one group of traders doing short-term trading but expecting long term results. Why do I say so?
Whenever a stock price goes down you will hear them asking why this why that. Stock doesnt go up in one
straight line, there are bound to have correction and if you are caught its due to bad timings.
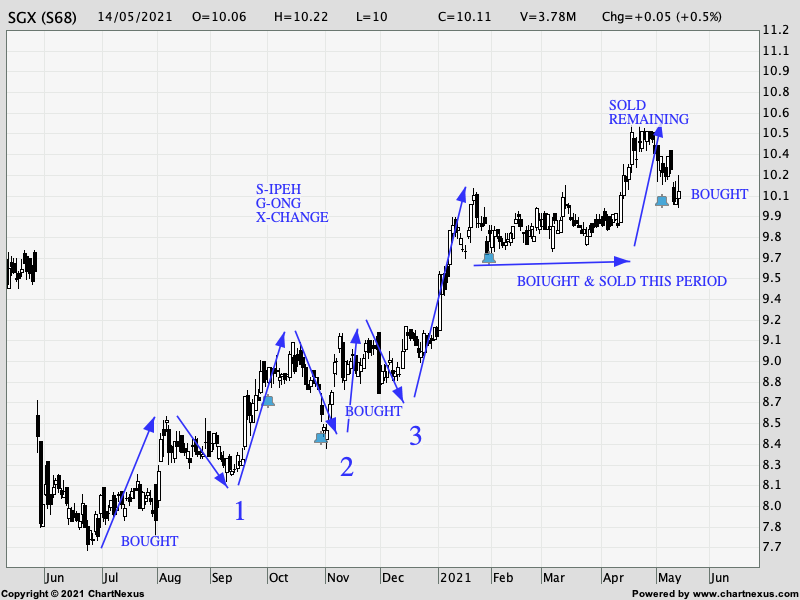
Different for a position traders who buy & hold for a longer period. For example my SGX position..I have to go
through 3 down moves to reach the peak and finally sold my remaining holdings at $10.58 after selling some
from $9.84 onwards.
How come I can hold ?
1- You must believe what you are buying, otherwise why you buy right?
2- Monitor if its a uptrending stocks(higher high and higher low and upward sloping moving averages).
So, first you believe then 2 the stock needs to confirm your belief by moving higher over the period of your holding.
Cheers
Moral of the story here chosing to be either a short-term or position trader or be both and be clear of your position.
All the br-easts.
stocks that I felt I didnt do too well which I may share in the near future.
Those recent trade leads to this sharing of short-term trading vs buy & hold position tradings.
See my yells " Timing the market Vs Time In The Market"
You will find one group of traders doing short-term trading but expecting long term results. Why do I say so?
Whenever a stock price goes down you will hear them asking why this why that. Stock doesnt go up in one
straight line, there are bound to have correction and if you are caught its due to bad timings.
Different for a position traders who buy & hold for a longer period. For example my SGX position..I have to go
through 3 down moves to reach the peak and finally sold my remaining holdings at $10.58 after selling some
from $9.84 onwards.
How come I can hold ?
1- You must believe what you are buying, otherwise why you buy right?
2- Monitor if its a uptrending stocks(higher high and higher low and upward sloping moving averages).
So, first you believe then 2 the stock needs to confirm your belief by moving higher over the period of your holding.
Cheers
Moral of the story here chosing to be either a short-term or position trader or be both and be clear of your position.
All the br-easts.
TikTalk ( Date: 14-May-2021 15:19) Posted:
|
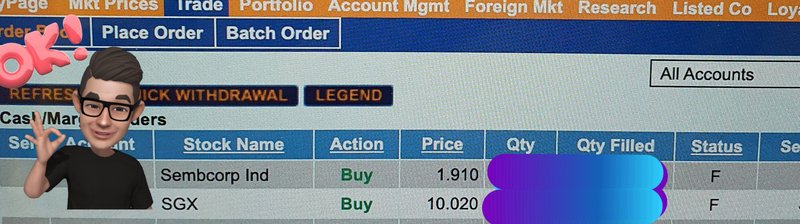
I am still holding to these that I bought last year....
TikTalk ( Date: 14-May-2021 15:19) Posted:
|
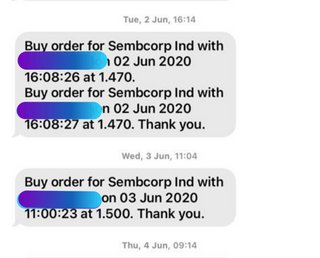
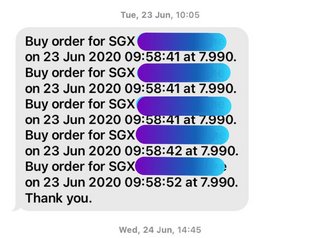
Found my trade confirmation for SGX purchased...
On the way up from there I bought again a few times till $9.06.
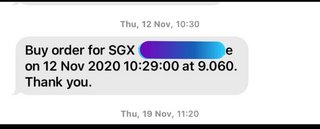
On the way up from there I bought again a few times till $9.06.
15th May 2021
Although SGX is trading nearer to its historical highs around $11+
If one do not owned this stock before to enjoy its run to date then its quite a big ask to do so at todays level.
I started buying SGX in June last year and has been booking profit on the way up and sold my last lot on 28th April.
Therefore I am just buying back to long again on this stock, correct decision or not I do not know. This time I will
not be holding it for that long a period.
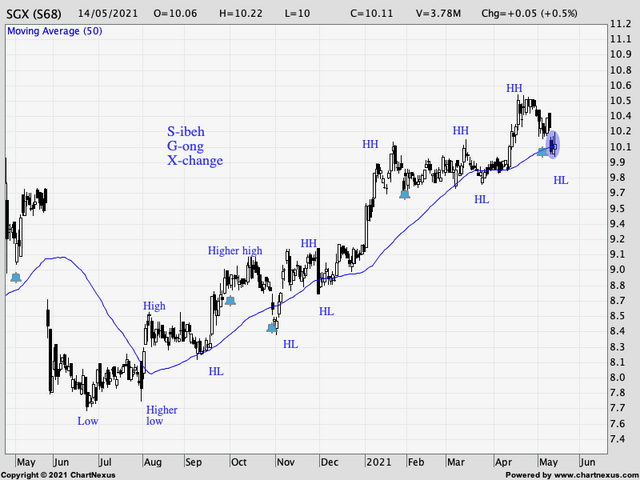
SGX is still on a uptrend define by one of the requirement of higher high and higher low price behavior.
Higher high and higher low basically means in layman words its getting more and more expensive, in hokkien
joo lai joo kwee, so potential buyers of this shares will have to pay higher in the future.
Of course after a certain level it will have to stop going higher, but we do not know where.
The other indicator to look at for a uptending stock is that the moving averages is pointing upward and act as
support for pullback in any stock.
Enjoy!
All the br-easts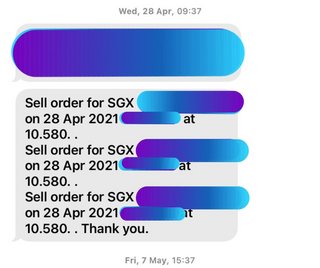
Although SGX is trading nearer to its historical highs around $11+
If one do not owned this stock before to enjoy its run to date then its quite a big ask to do so at todays level.
I started buying SGX in June last year and has been booking profit on the way up and sold my last lot on 28th April.
Therefore I am just buying back to long again on this stock, correct decision or not I do not know. This time I will
not be holding it for that long a period.
SGX is still on a uptrend define by one of the requirement of higher high and higher low price behavior.
Higher high and higher low basically means in layman words its getting more and more expensive, in hokkien
joo lai joo kwee, so potential buyers of this shares will have to pay higher in the future.
Of course after a certain level it will have to stop going higher, but we do not know where.
The other indicator to look at for a uptending stock is that the moving averages is pointing upward and act as
support for pullback in any stock.
Enjoy!
All the br-easts
TikTalk ( Date: 14-May-2021 15:19) Posted:
|

cucina ( Date: 15-May-2021 13:21) Posted:
|
My heartiest CONGRATULATIONS on the opening of your new thread.
I can already see that your focus is all about charts, TA and trading.
As always, all the breasst, Bro TikTok.
Plus tua tua liap ones some more for you.
.

I can already see that your focus is all about charts, TA and trading.
As always, all the breasst, Bro TikTok.
Plus tua tua liap ones some more for you.
.
15th May 2021
In my earlier SCI chart I used the synergy of someone patronizing the same place as ' habitual being' .
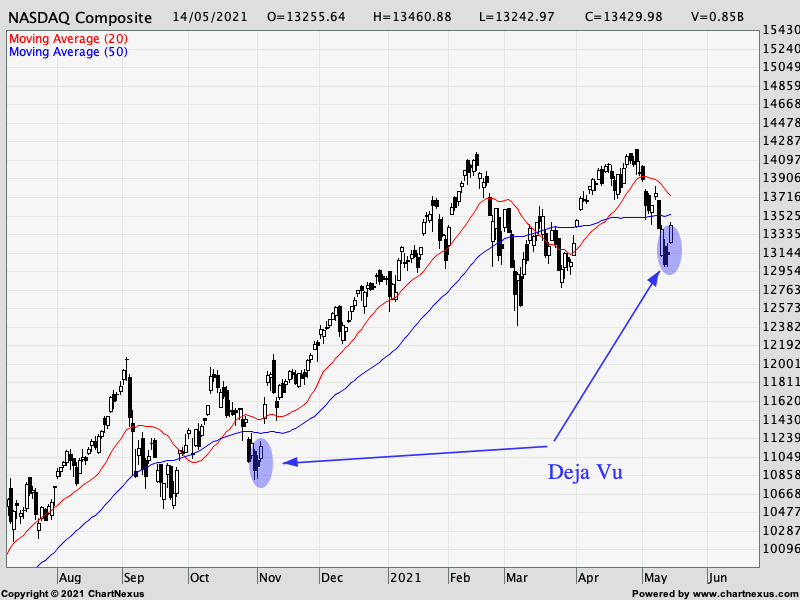
Now, you will be seeing how history do repeat itself a question I ask in the same SCI post.
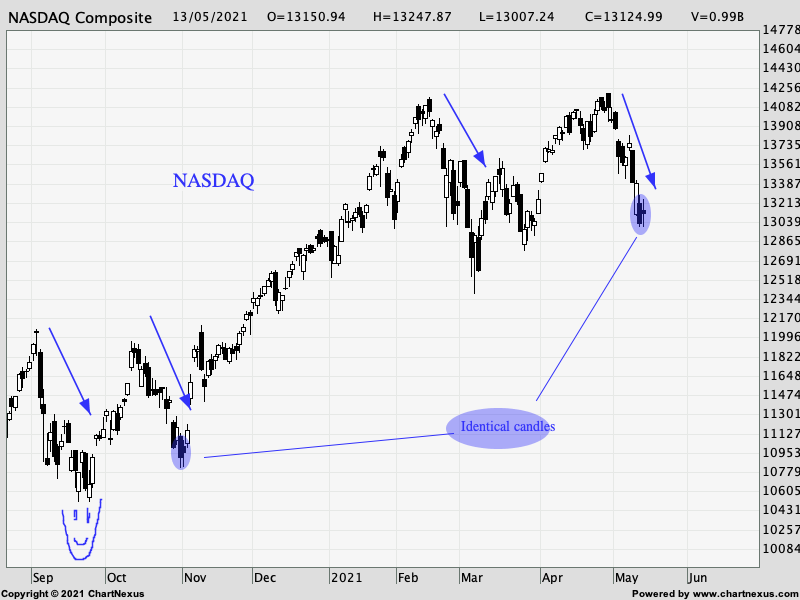
See the last 3 candle sticks in the shaded areas in below chart.
Its DEJA VU in different location, Singapore and United States, or the S-ipeh G-ong X-change and Nasdaq.
Enjoy!
All the br-easts.
In my earlier SCI chart I used the synergy of someone patronizing the same place as ' habitual being' .
Now, you will be seeing how history do repeat itself a question I ask in the same SCI post.
See the last 3 candle sticks in the shaded areas in below chart.
Its DEJA VU in different location, Singapore and United States, or the S-ipeh G-ong X-change and Nasdaq.
Enjoy!
All the br-easts.
TikTalk ( Date: 14-May-2021 12:53) Posted:
|
" I highlighted this 2 gaps of relevent because if a more severe correction were to continue in the days ahead an
attempt to fill that runaway gap is always open."
On Thursday I brought up the subject on ' Gaps' and (highlighted two types, runaway and exhaustion gap.
Never did I expected it to be filled the next day.
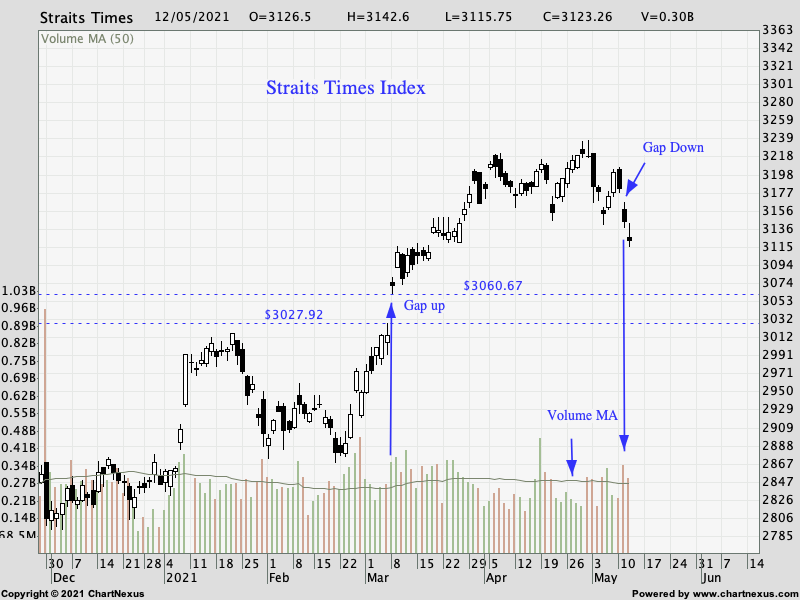
Now, I do not know how many local cases of infections will be reported in the coming days and how would
market react to those upcoming news. Assuming that US market behave itself next week and in May to provide
some cushion or even lift our badly damaged S-ibeh T-erok I-ndex(some already know my humour in naming them).
Will STI recover to fill that exhaustion gap?
Weekend have more time to share more charts and hope passer by do enjoy it.
There are unfill gap way below but will not highlight them at the moment because it will need a bear market to fill them.
All the br-east
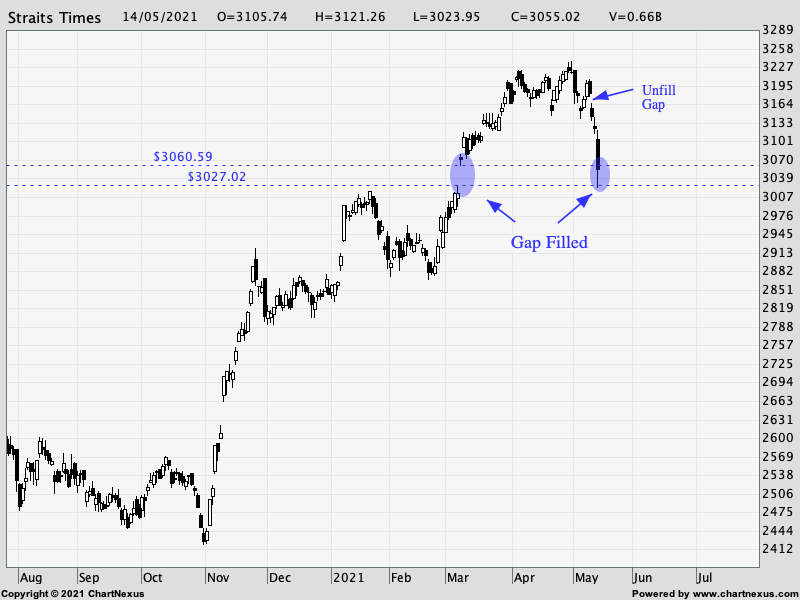
attempt to fill that runaway gap is always open."
On Thursday I brought up the subject on ' Gaps' and (highlighted two types, runaway and exhaustion gap.
Never did I expected it to be filled the next day.
Now, I do not know how many local cases of infections will be reported in the coming days and how would
market react to those upcoming news. Assuming that US market behave itself next week and in May to provide
some cushion or even lift our badly damaged S-ibeh T-erok I-ndex(some already know my humour in naming them).
Will STI recover to fill that exhaustion gap?
Weekend have more time to share more charts and hope passer by do enjoy it.
There are unfill gap way below but will not highlight them at the moment because it will need a bear market to fill them.
All the br-east
TikTalk ( Date: 13-May-2021 19:47) Posted:
|
Good luck Sis Cucina,
Just posted another writing below...
All the br-east ya.
Just posted another writing below...
All the br-east ya.
cucina ( Date: 14-May-2021 15:20) Posted:
|
15th May 2021
I did mentioned earlier of this irrational selling due to recent increase in local covid cases.
People rush to sell stocks just like those rush to buy groceries...
I wouldnt know for sure if my purchase of SCI at this level is the right thing as we cant really
predict the transimision of virus a invisible enemy of recent time..
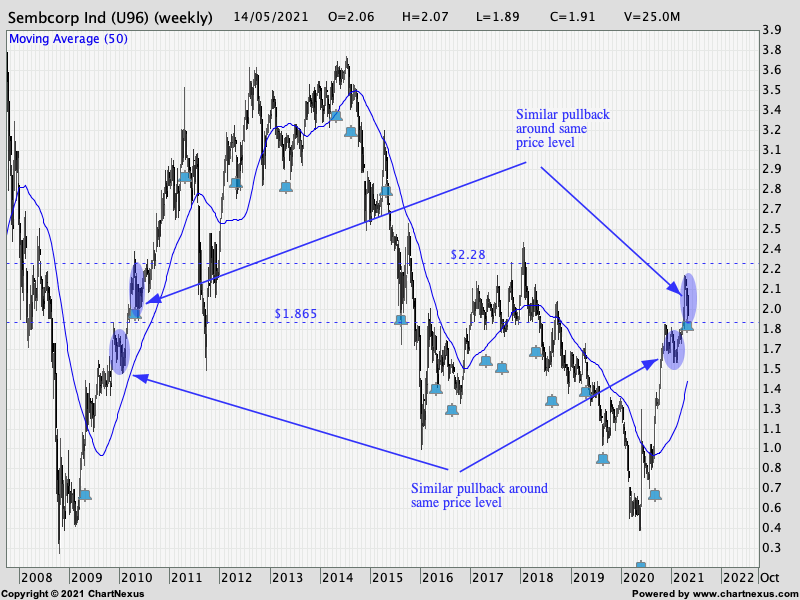
Will just share some chart observation with my readers near and far(maybe will explain this one day).
Looking at chart for trend, support and resistance, etc.....one of the things I quietly look for is something
quite interesting. Often we ask the question Does history repeat itself?
Well, I am going to highlight in below chart shaded areas that price behaviour do re-occur at times not in
the exact 100% mirroring but looks identical at a glance.
Afterall price chart are created by human who speculate or investing in company shares. I find myself
going to the same coffee shop for similar foods rather regularly, and if you find what I said also happen
to you then there may be others too and thats how these same people maybe trading stocks too just
like me.
We are HABITUAL BEING.
Not meant to solicit anyone into buying or selling, so its entirely your decision to act or react on your own responsibility.
Hope above is of relevant otherwise enjoy reading as weekend past time.
All the br-east
I did mentioned earlier of this irrational selling due to recent increase in local covid cases.
People rush to sell stocks just like those rush to buy groceries...
I wouldnt know for sure if my purchase of SCI at this level is the right thing as we cant really
predict the transimision of virus a invisible enemy of recent time..
Will just share some chart observation with my readers near and far(maybe will explain this one day).
Looking at chart for trend, support and resistance, etc.....one of the things I quietly look for is something
quite interesting. Often we ask the question Does history repeat itself?
Well, I am going to highlight in below chart shaded areas that price behaviour do re-occur at times not in
the exact 100% mirroring but looks identical at a glance.
Afterall price chart are created by human who speculate or investing in company shares. I find myself
going to the same coffee shop for similar foods rather regularly, and if you find what I said also happen
to you then there may be others too and thats how these same people maybe trading stocks too just
like me.
We are HABITUAL BEING.
Not meant to solicit anyone into buying or selling, so its entirely your decision to act or react on your own responsibility.
Hope above is of relevant otherwise enjoy reading as weekend past time.
All the br-east
TikTalk ( Date: 14-May-2021 15:19) Posted:
|
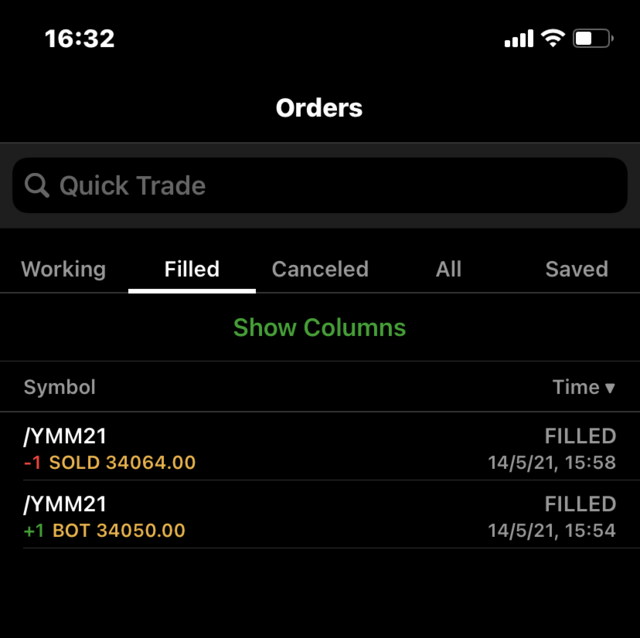
Another quick trade for Dow futures...2nd trade today
Bro TikTalk,
SGX is in my watchlist.
SCI - I already has, bgt at 2.05, shall hold it.
SGX is in my watchlist.
SCI - I already has, bgt at 2.05, shall hold it.
TikTalk ( Date: 14-May-2021 15:19) Posted:
|
Try try...