
tks so much master! if Keppel follows Semb pattern... upside HUAT!
TikTalk ( Date: 22-May-2021 11:54) Posted:
|
Thanks spidey for visiting this thread.
Yes, we all made decision which stock to buy and sometime chose the right one sometime not so right
and it mostly due to market timing the stock.
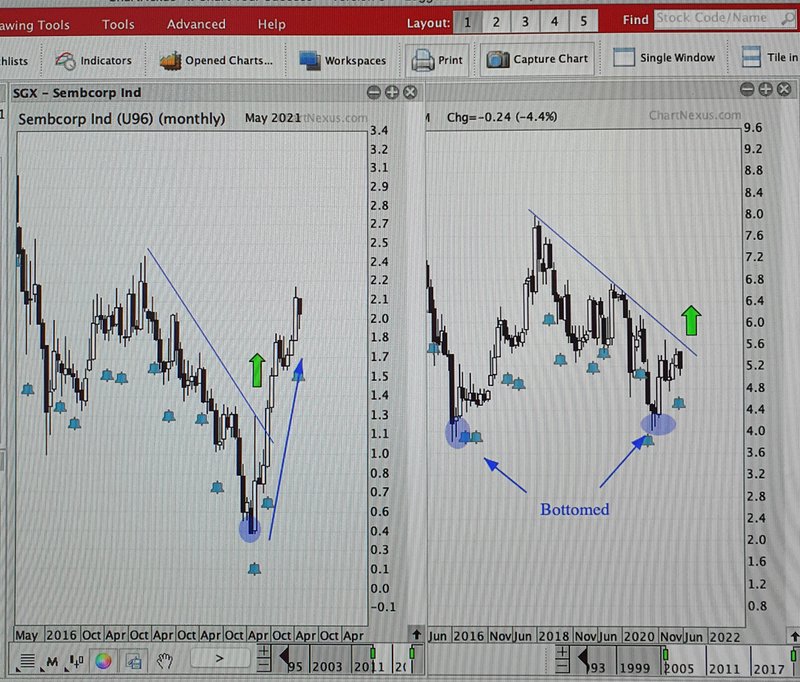
Here is a chart comparison between Sembcorp Ind and Keppel Corp, left and right chart respectively.
Keppel suffered when Temasek abandoned its offer but the last result announcement it rallied, I bought and sold them.
Sembcorp broke to the upside and rallied eversince it disowned her child(SembMarine) a lost making baby.
I bought pre demerger and still holding..
Do not rule out Keppel, as it has already bottomed just like in 2016 and now 4 1/2 year later in Oct 2020.
Its time will come when it can break above the downtrend line (see green arrow).
All the br-east
Yes, we all made decision which stock to buy and sometime chose the right one sometime not so right
and it mostly due to market timing the stock.
Here is a chart comparison between Sembcorp Ind and Keppel Corp, left and right chart respectively.
Keppel suffered when Temasek abandoned its offer but the last result announcement it rallied, I bought and sold them.
Sembcorp broke to the upside and rallied eversince it disowned her child(SembMarine) a lost making baby.
I bought pre demerger and still holding..
Do not rule out Keppel, as it has already bottomed just like in 2016 and now 4 1/2 year later in Oct 2020.
Its time will come when it can break above the downtrend line (see green arrow).
All the br-east
spidey ( Date: 22-May-2021 11:20) Posted:
|
wow u caught the bottom... really guru leh
TikTalk ( Date: 14-May-2021 15:19) Posted:
|
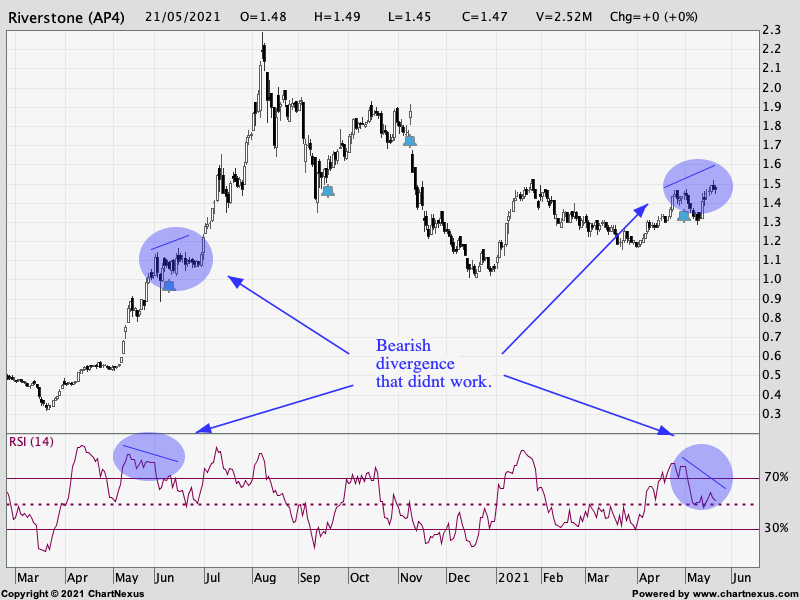
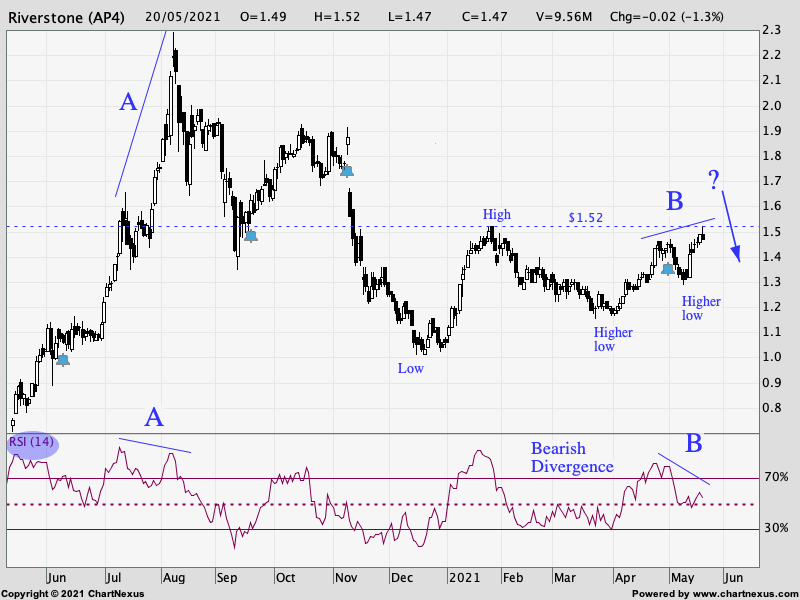
I like to correct my earlier post on Riverstone..
Just realised that not all the time Rsi divergence works. Therefore it work or not this time remain open.
If the pullback is small like last May/June period then it may not work and thereafter prices move higher
as other indicators that are showing positive signs namely DMI and Ichimoku Kinko Hyo(read from Sis Cucina post).
Luckily I relook at Riverstone chart.
TikTalk ( Date: 20-May-2021 20:08) Posted:
|
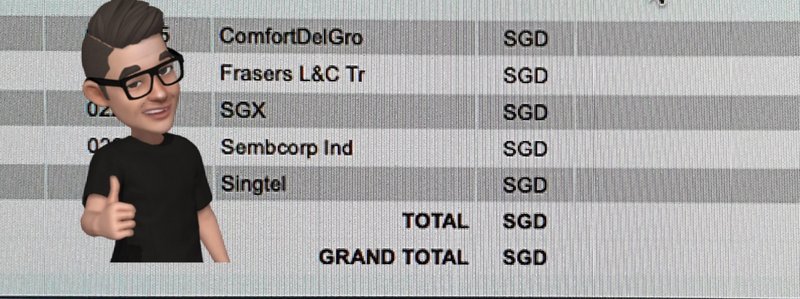
thanks for showing us your portfolio ! you are the br-east!
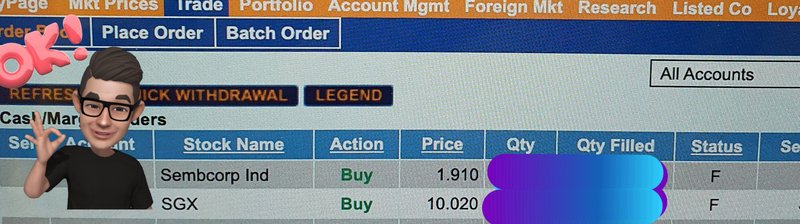
i was deciding between kepcorp and SembInd for my virgin trade since the big losses in Mar last year...
decided to go for latter... wish us luck! :)
i was deciding between kepcorp and SembInd for my virgin trade since the big losses in Mar last year...
decided to go for latter... wish us luck! :)
TikTalk ( Date: 21-May-2021 07:42) Posted:
|
Saturday
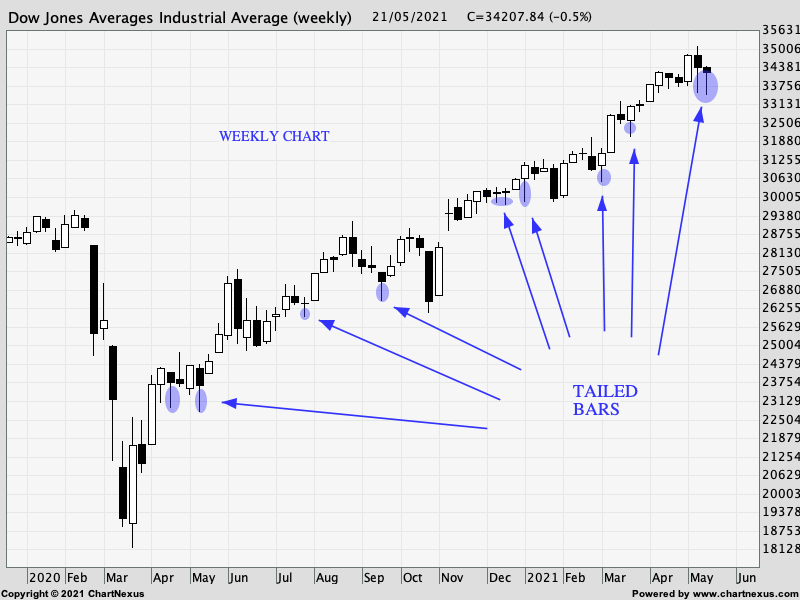
Dow Jones Weekly Chart - Tailed Bars
There are many types of tailed bars, short or long tails typically found in hammer, hanging man and dojis.
Common explaination of such price behavior is that potential sellers came into the market pushing it lower but was absorbed my
potential buyers.
Now, you notice I use the word " potential buyers or potential sellers" , you see for every buyer there is a seller to complete a transaction
recorded as " volume" traded. " Potential" means there are a lot more buyers queueing to buy than sellers queueing to sell which
is why sellers were force to retreat in our tailed bars interpretation, thus prices goes higher to closed near opening level.
Therefore if the candle sticks pattern is opposite then there are more potential sellers than potential buyers and buyers will be force to retreat thus prices goes lower.
Hope you enjoy reading and wishes everyone a happy weekend, stay safe.
All the br-east
Indeed, I am really hoping the Sibeh Terok Index recovers otherwise it will indirectly influence our FLCT share price performance since it is part of it, although it is the 3 banks which hold majority of the Sibeh Terok Index overall weightage.
TikTalk ( Date: 21-May-2021 19:42) Posted:
|
Agree Bro. Nevertheless, hope it rises up gradually. Cheers to us ! 
TikTalk ( Date: 21-May-2021 13:36) Posted:
|
Thanks boiboi and welcome to Trading For A Living...hope you will enjoy your stay here.
boiboi ( Date: 21-May-2021 20:40) Posted:
|
Well analysed Master Tiktalk
TikTalk ( Date: 21-May-2021 19:42) Posted:
|
🙏 🏻 Just lucky Bro.
wavehunter ( Date: 21-May-2021 19:40) Posted:
|
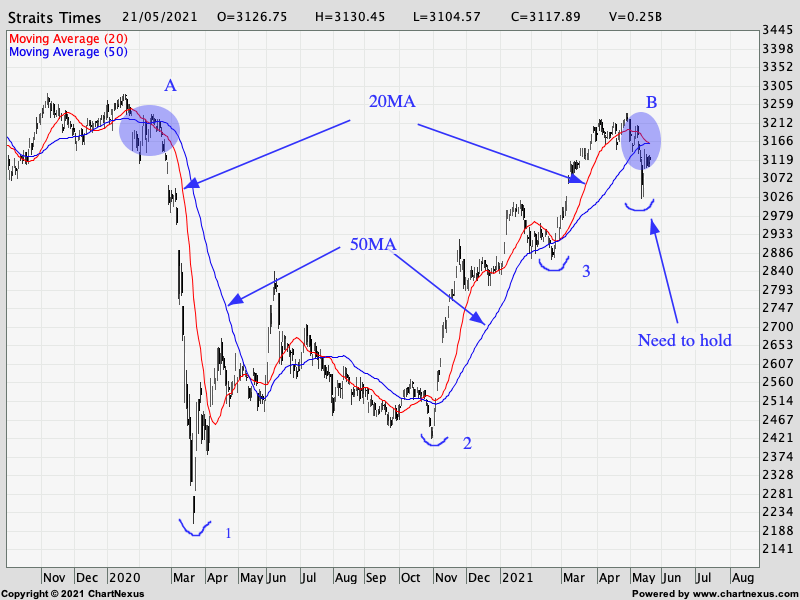
STI - 20 & 50 MA
20ma must not cross under the into the 50ma just like " A" , therefore STI must recover to above both
the 20/50MA labbelled " B" .
Recent low must hold too.
Good luck.
20ma must not cross under the into the 50ma just like " A" , therefore STI must recover to above both
the 20/50MA labbelled " B" .
Recent low must hold too.
Good luck.
You goodah !!! 
HUAT arrr !!!

HUAT arrr !!!
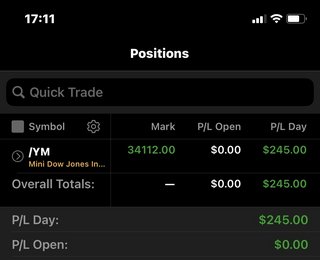
TikTalk ( Date: 21-May-2021 17:17) Posted:
|
Today p/l for Dow futures trading.
Bro including divs collected its price is essentially still at 1.46/1.47 level tio bo...
still holding better than most reits.
still holding better than most reits.
yoga123 ( Date: 21-May-2021 11:33) Posted:
|
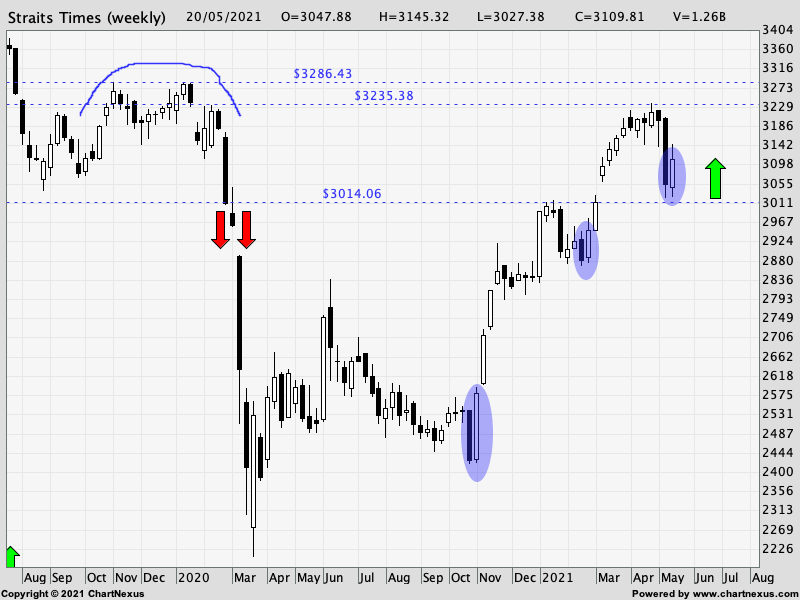
Friday is a good day to see how your weekly chart will looks like to plan whether you
wanna do anything to your stock or portfolio or leave it till next week.
So far those 3 shaded areas has prevented the S-ipeh T-erok I=ndex from sliding further south.
If the market wanted to go lower it would have did what the red arrow on the left as we hit the low
at abour similar area. Since did not go down means it wants to go up, fair?
The next question of course for buyers of recent correction will be how high can we go from here?
Look to the left of the chart we should expect a huge mountain to clear between 3235 to 3286.
I am not saying it may not clear but just saying to manage our expectation as it comes. The fact
is that the market corrected from around the same levels.
All the br-east
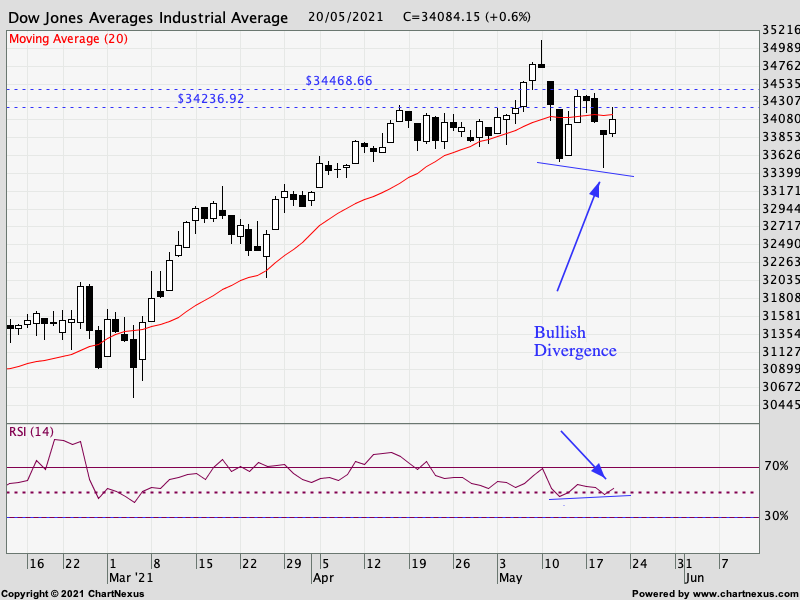
Early I show an example of a bearish divergence using Riverstone.
Now I use Dow Jones as an example of a bullish divergence from RSI
Although Dow is not in oversold condition in this case I am using it to see
if a turn after a correction has developed, also just wanna share an example
of the concept of divergences.
Example of RSI Divergences
A bullish divergence occurs when the RSI creates an oversold reading followed by a higher low that matches correspondingly lower lows in the price. This indicates rising bullish momentum, and a break above oversold territory could be used to trigger a new long position.
A bearish divergence occurs when the RSI creates an overbought reading followed by a lower high that matches corresponding higher highs on the price.
Above copy and paste from Investopedia..
Yeah Bro, patience is the key. 👍
TikTalk ( Date: 21-May-2021 11:11) Posted:
|
Bro Yoga123,
Thanks for dropping by ya reits not in play at the moment, gotta wait dunno how long lor.
Just hold for sometime then see how...
Thanks for dropping by ya
reits not in play at the moment, gotta wait dunno how long lor.Just hold for sometime then see how...
yoga123 ( Date: 21-May-2021 10:01) Posted:
|
Bro TikTalk, you are also in FLCT ? What' s your view about it, I bought it previously at 1.47 before it joined the Sibeh Terok Index.
Wished I had the courage to average down at 1.37 but did not do so. Sigh.. 😆
Wished I had the courage to average down at 1.37 but did not do so. Sigh.. 😆
TikTalk ( Date: 21-May-2021 07:42) Posted:
|