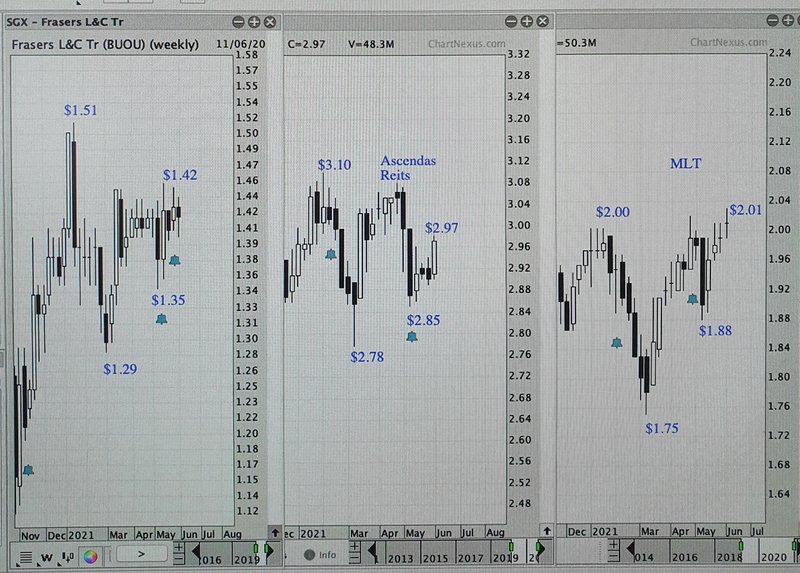
Comparing Fraser Logistic, Ascendas and Mapletree Logistic
This year Jan high/lMarch low/now -
Fraser LCT $1.51/1.29/1.42.
Ascendas $3.10/2.78/2.97.
MLT $2.00/1.75/2.01
Since Jan 2021
Fraser LCT down 9 cents -5.96%
Ascendas down 13 cents -4.19%
MLT up 1 cents +0.05%
Since March low
Fraser LCT up 13 cents +10%
Ascendas up 19 cents +6.78%
MLT up 26 cents +14.85%
Based on above Mapletree Logistic has outperformed since 2021 and since March low.
Fraser has underperformed since 2021. Ascendas has underperformed since March low.
Since stock all time high of each stock price, Fraser high $1.51, Ascendas high $3.19 and MLT high $2.14,
then Fraser - 5.96%, Ascendas - 6.89% and MLT 6.07%, not a whole lot of different though Ascendas was
the worse performer in this classification and can change depending on how they perform from here.
Fraser has outperformed in the sense that it has hold up its value slightly better.
All the bre@st to whichever reits you prefer.
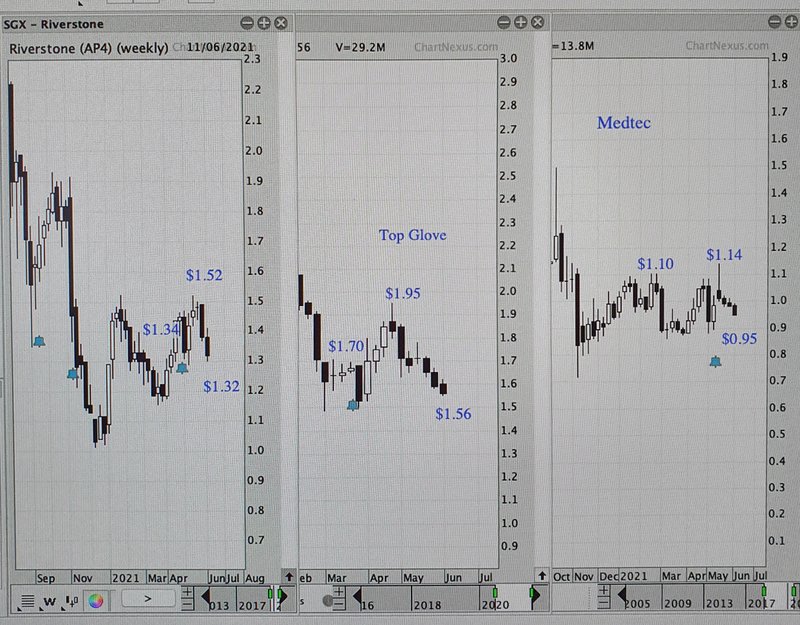
Comparing Riverstone, Top Glove & Medtec.
Riverstone March High $1.34, May High $1.52 Now $1.32
Top Gove March High $1.70, May High $1.95 Now $1.56
Medtec March High $1.06, May High $1.14 Now $0.95
Since March Riverstone is 2 cents below its March high, while Top Glove is 14 cents below and
Medtec is 11 cents below its March high, -1.5%, -8%, and -10.4% respectively
Since March Riverstone rallied to a high by 18 cents, Top Glove rallied by 25 cents and
Medtec rallied only 8 cents to its May high, +13.4%, +14.7% and +7.5% respectively.
Since May high, Riverstone was down 20 cents while Top Glove was down 39 cents and
Medtec was down 19 cents, -13%, -20% and -16.6% respectively.
Based on above Riverstone has outperformed during recent time in the glove sector and Medec
has underperformed badly.
All the bre@st to whichever counter you prefer.
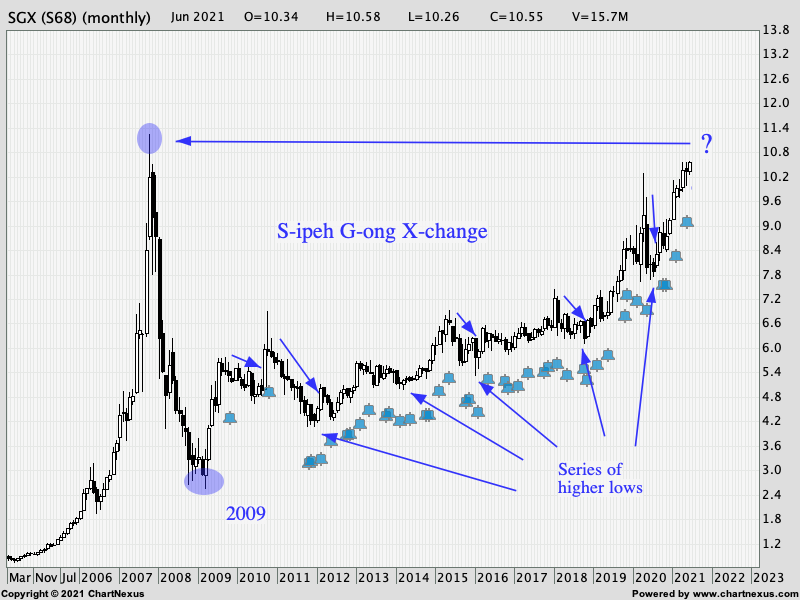
SGX : S-ipeh G-ong X-change-Monthly Chart
Haha, looking back 2009 was a significant low and ever since its been on a uptrend till now.
Inbetween there were a series of highlow after each mini bear market and the most recent
covid bear in 2020. My best purchased was $7.99 and on the way up but has sold off all.
Traded recently with some profits too.
Short term trading I hope to get another chance to go long as I feel
it will test the old high around 11.24 registered in Oct 2007.
Long term, I too believe SGX will make new high in the coming years but for that I will wait for a deeper correction
or one of those mini bear market(some time in the not too distance future) to buy and hold.
All the bre@st
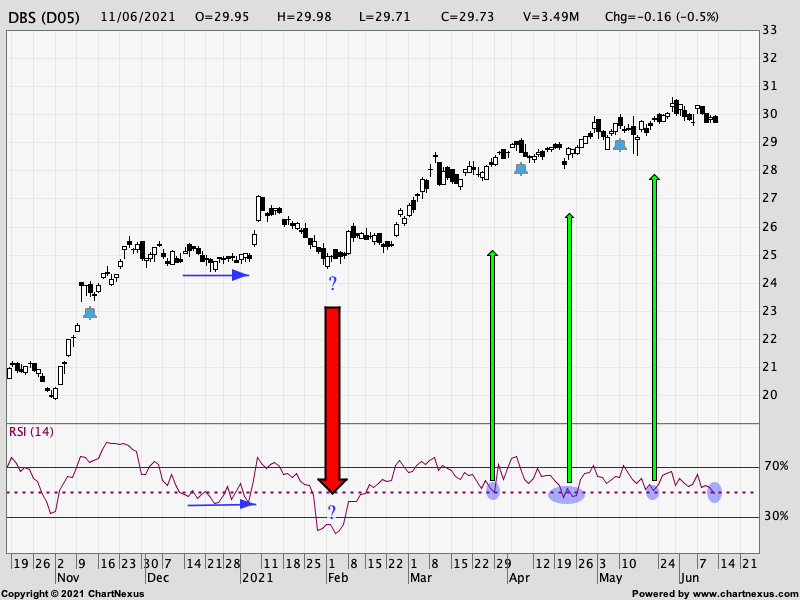
DBS - Daily Chart : Relative Streight Index (RSI)
Rsi seems to bounce of the 50% marke on the RSI in each of the last 3 months and interestingly
its has been around the 3rd to 4th week of March, April & May. Haha we are going into the 3rd
week of June, therefore are we going to see DBS moving higher in the coming weeks?
The other 2 scenerios would be a prolong period of consolidation like in Dec 2020 or a more bearish
one like in Jan 2021 where RSI went down further to 30% level.
I am more incline to go with the more recent months.
Cheers & all the bre@st.
By
Updated Jan 14, 2021
What is a Symmetrical Triangle
A symmetrical triangle is a chart pattern characterized by two converging trend lines connecting a series of sequential peaks and troughs. These trend lines should be converging at a roughly equal slope. Trend lines that are converging at unequal slopes are referred to as a rising wedge, falling wedge, ascending triangle, or descending triangle.
KEY TAKEAWAYS
- Symmetrical triangles occur when a security' s price is consolidating in a way that generates two converging trend lines with similar slopes.
- The breakout or breakdown targets for a symmetrical triangle is equal to the distance between the initial high and low applied to the breakout or breakdown point.
- Many traders use symmetrical triangles in conjunction with other forms of technical analysis that act as a confirmation.
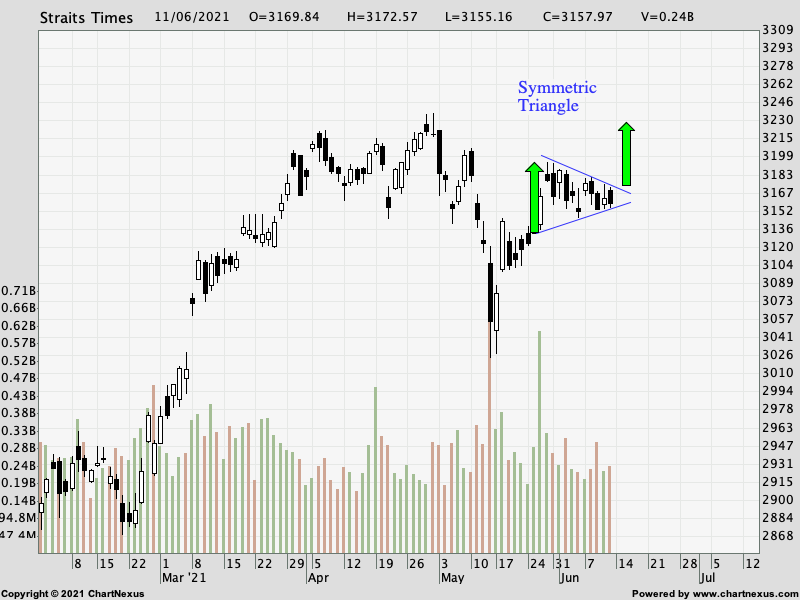
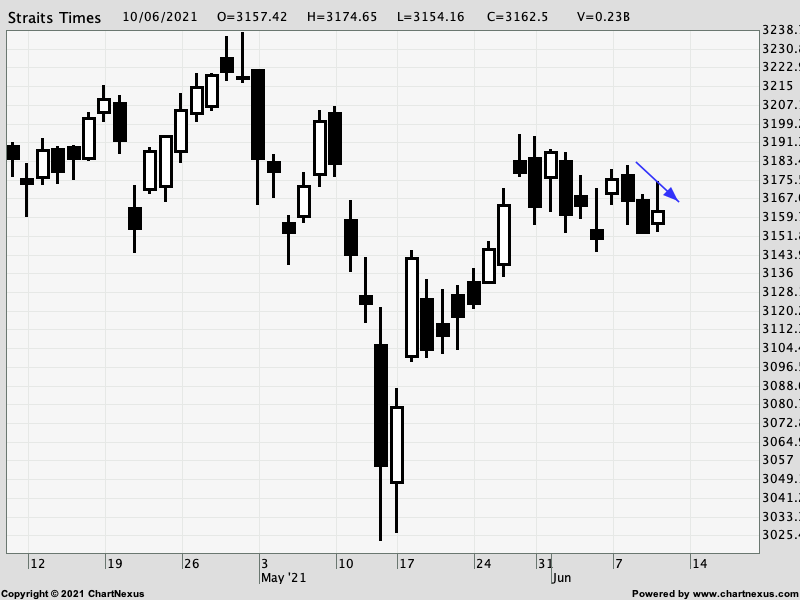
Above is a STI daily chart.
The objective if break on the upside will be the height of the green arrow which is about the 3230 levels.
Of course it can also breakdown but these are usually continuation pattern.
All the bre@st.
STI - S-ipeh T-erok I-ndex
Daily & Weekly Chart
From the daily chart STI is consolidating between the 20 and 50 days ma.
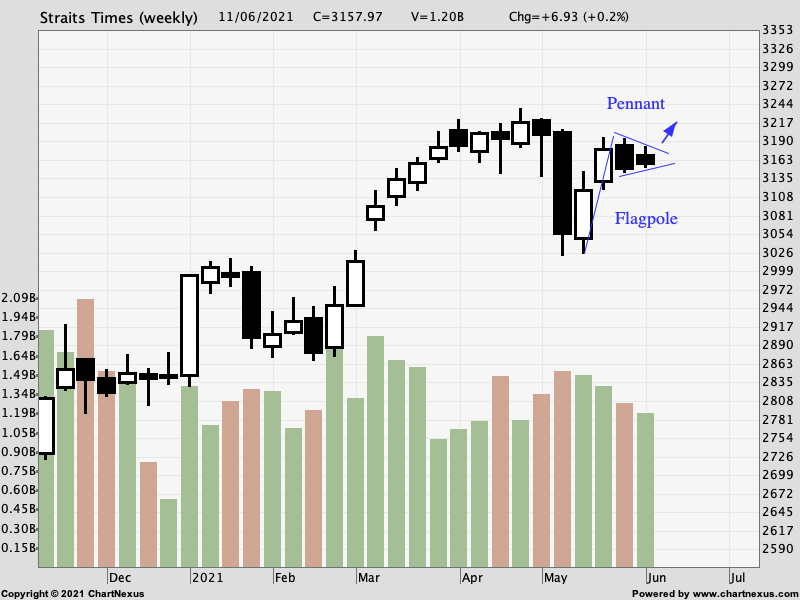
The weekly chart picture a pennant pattern.
In technical analysis, a pennant is a type of continuation pattern formed when there is a large movement in a security, known as the flagpole, followed by a consolidation period with converging trend lines&mdash the pennant&mdash followed by a breakout movement in the same direction as the initial large movement, which represents the second half of the flagpole.
Pennants, which are similar to flags in terms of structure, have converging trend lines during their consolidation period and last from one to three weeks. The volume at each period of the pennant is also important. The initial move must be met with large volume while the pennant should have weakening volume, followed by a large increase in volume during the breakout.
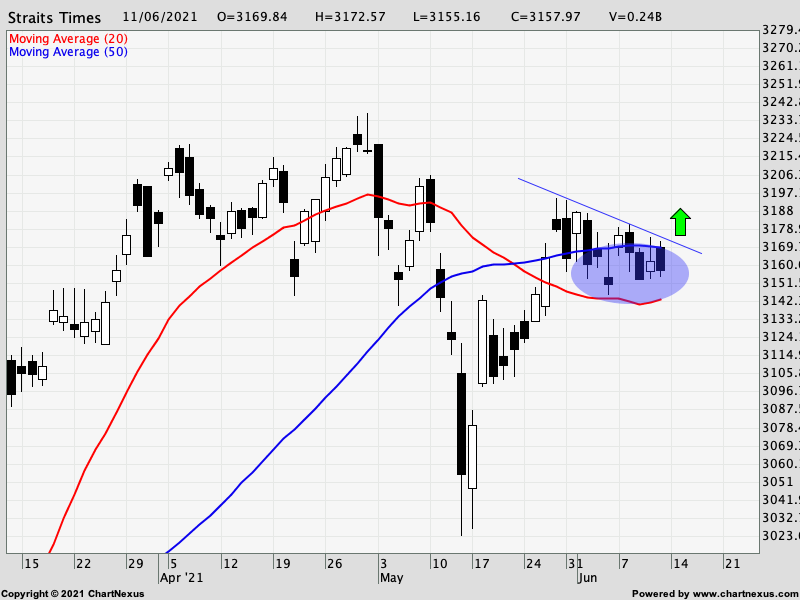
Daily & Weekly Chart
From the daily chart STI is consolidating between the 20 and 50 days ma.
The weekly chart picture a pennant pattern.
By
:max_bytes(150000):strip_icc()/photo__james_chen-5bfc26144cedfd0026c00af8.jpeg)
Updated Nov 3, 2020
What Is a Pennant?
In technical analysis, a pennant is a type of continuation pattern formed when there is a large movement in a security, known as the flagpole, followed by a consolidation period with converging trend lines&mdash the pennant&mdash followed by a breakout movement in the same direction as the initial large movement, which represents the second half of the flagpole.
- Pennants are continuation patterns where a period of consolidation is followed by a breakout used in technical analysis.
- It' s important to look at the volume in a pennant&mdash the period of consolidation should have lower volume and the breakouts should occur on higher volume.
- Most traders use pennants in conjunction with other forms of technical analysis that act as confirmation.
Understanding Pennants
Pennants, which are similar to flags in terms of structure, have converging trend lines during their consolidation period and last from one to three weeks. The volume at each period of the pennant is also important. The initial move must be met with large volume while the pennant should have weakening volume, followed by a large increase in volume during the breakout.
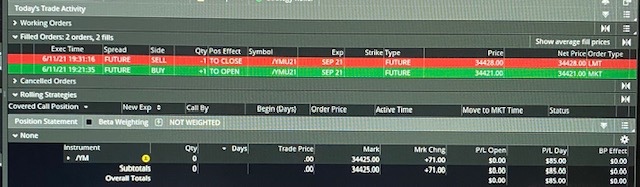
Dinner with Mr Jones...another 7 bids.
Total so far usd85/-
Total so far usd85/-
Gardens by the Bay?
Nice glass artwork.
Nice glass artwork.
TikTalk ( Date: 11-Jun-2021 16:16) Posted:
|
Just came back from cycling..

Morning made usd50 so far from 2 trades 5 bids each.
Thank you Mr Jones.
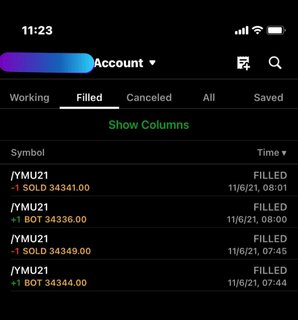
Thank you Mr Jones.
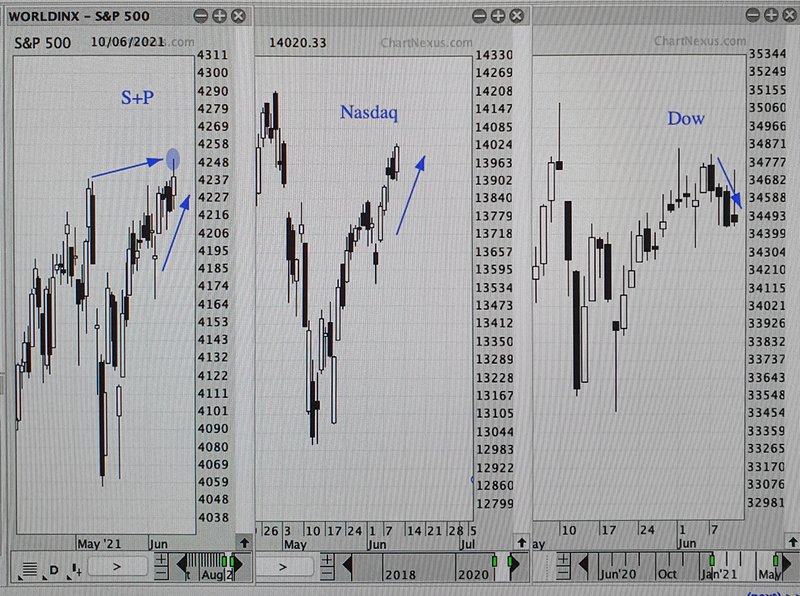
STI move is closer to Dow in the last 4 days.
S+P had a record high yesterday holding on to earlier gains while Nasdaq move higher throughout the day,
but Dow retreated early gains to closed little change.
STI as of now at 3166 is down 3 points for the week, sideway market, will see later its closing level.
S+P had a record high yesterday holding on to earlier gains while Nasdaq move higher throughout the day,
but Dow retreated early gains to closed little change.
STI as of now at 3166 is down 3 points for the week, sideway market, will see later its closing level.
Sis,
Breakfast with Mr Jones...
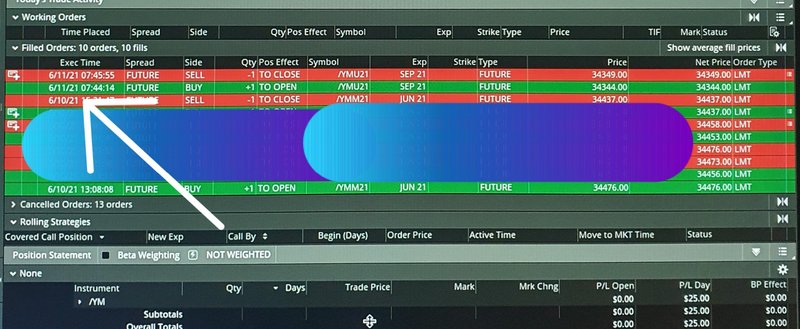
Breakfast with Mr Jones...
halleluyah ( Date: 10-Jun-2021 21:58) Posted:
|
u good deh Sis 
halleluyah ( Date: 10-Jun-2021 21:58) Posted:
|
hello Bro TikTalk thanks for the breaking news 
u are good Sis
CheeryVGoh ( Date: 10-Jun-2021 17:24) Posted:
|