
Tik' s Corner
Rank - Master Score - 1606 Whats this?
Back to Inbox
| Subject: | Re: ISDN |
| From: | TikTalk |
| Date: | 04-May-2021 12:32 |
| Delete | Archive this! | |
See if will behaviour in the same manner and position for a July rally. Meantime maybe got chance to trade between now and July. After this down move, go up then down again before July rally. Just base on market behaviour and cycle. 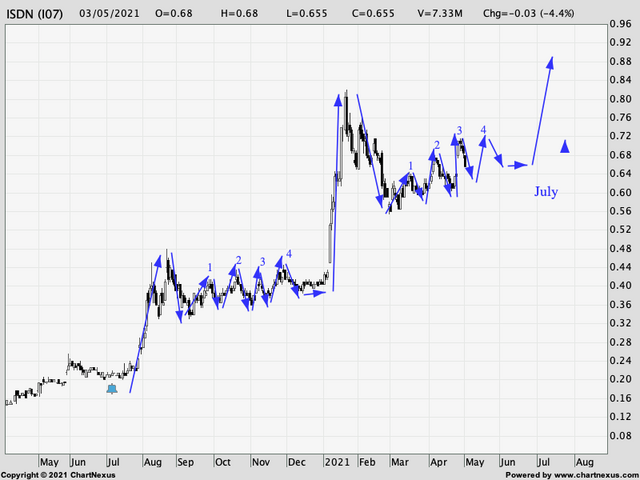 Above was my PM to a member in SJ on a possible rally in July. Will it happen sooner than I thought? I like today price movement and volumes. Good if continue to go up tomorrow, down(on low volume) is even better for me. All the bre@st  |
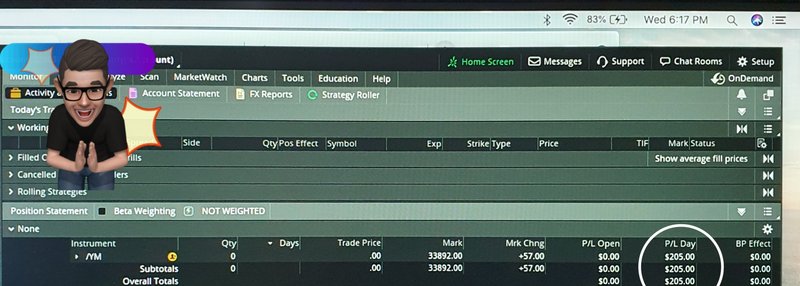
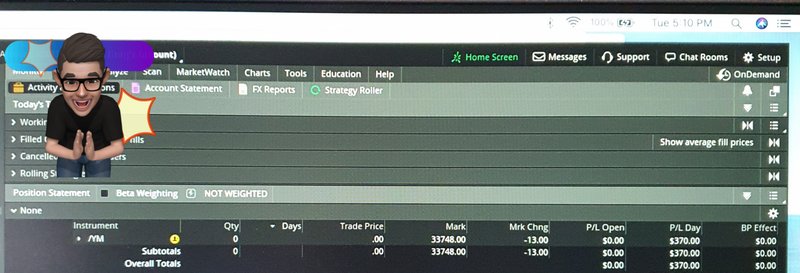
Dow p/l so far. +205..dinner time soon
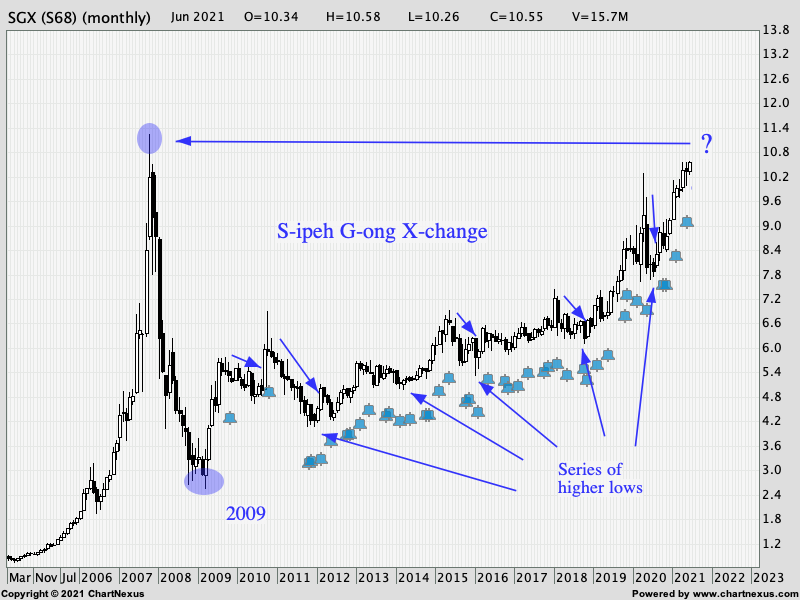
" Short term trading I hope to get another chance to go long as I feel
it will test the old high around 11.24 registered in Oct 2007."
I missed the boat liao...
Have to wait long long again...
it will test the old high around 11.24 registered in Oct 2007."
I missed the boat liao...
Have to wait long long again...
TikTalk ( Date: 12-Jun-2021 13:21) Posted:
|
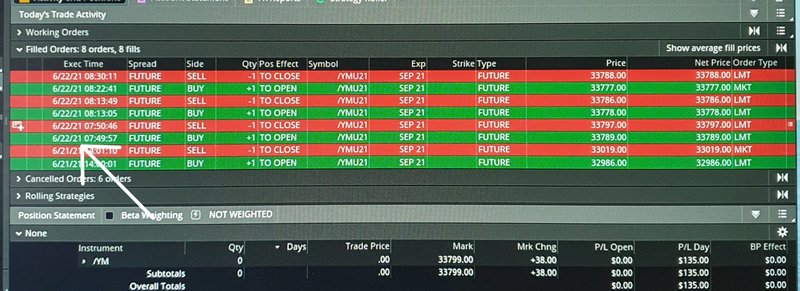
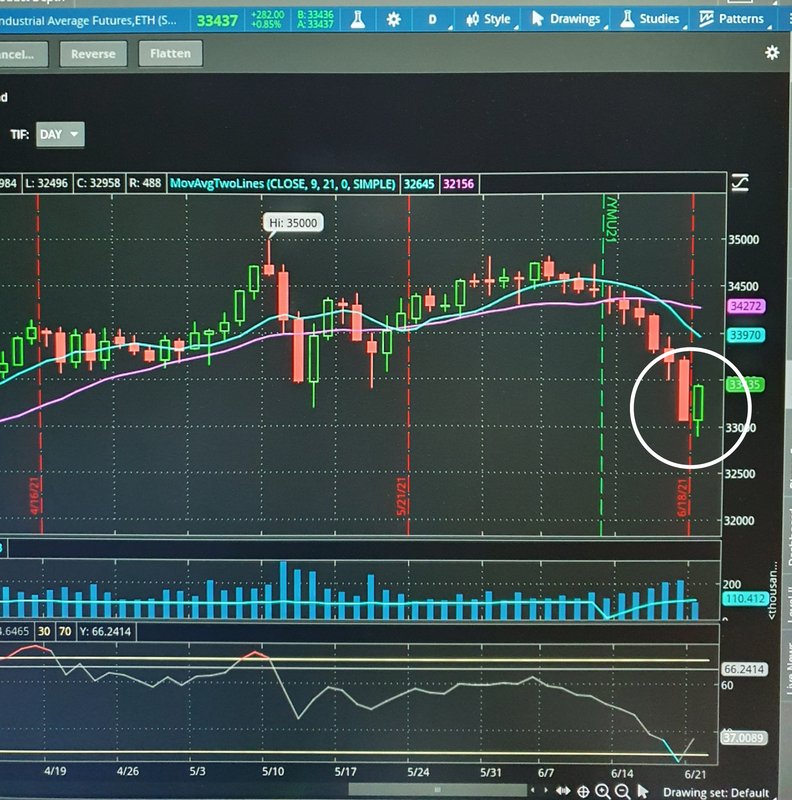
Morning breakfast with Mr Jones (Dow futures)
Thank you Bro for the helpful chart analysis 
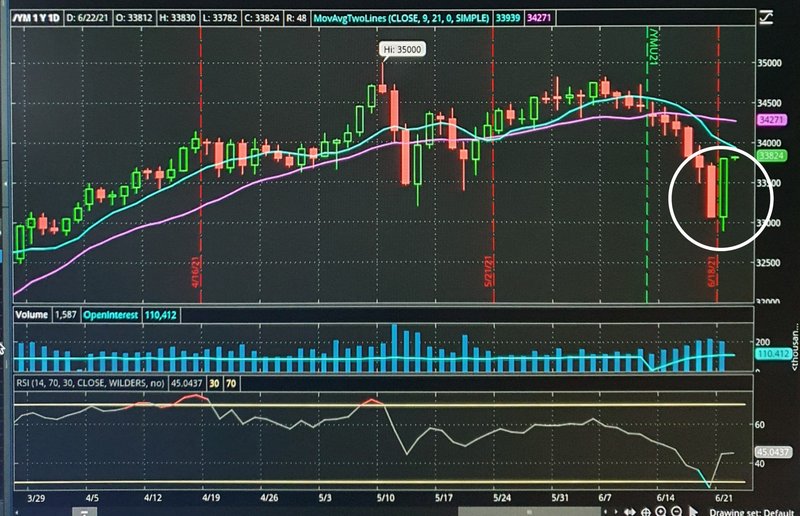
TikTalk ( Date: 22-Jun-2021 11:52) Posted:
|
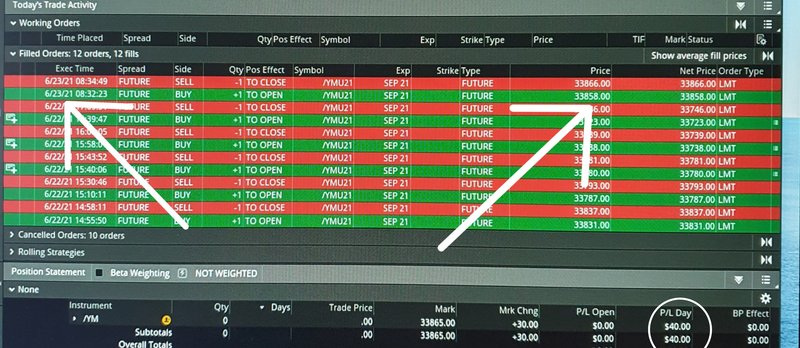
Afternoon Dow futures p/l
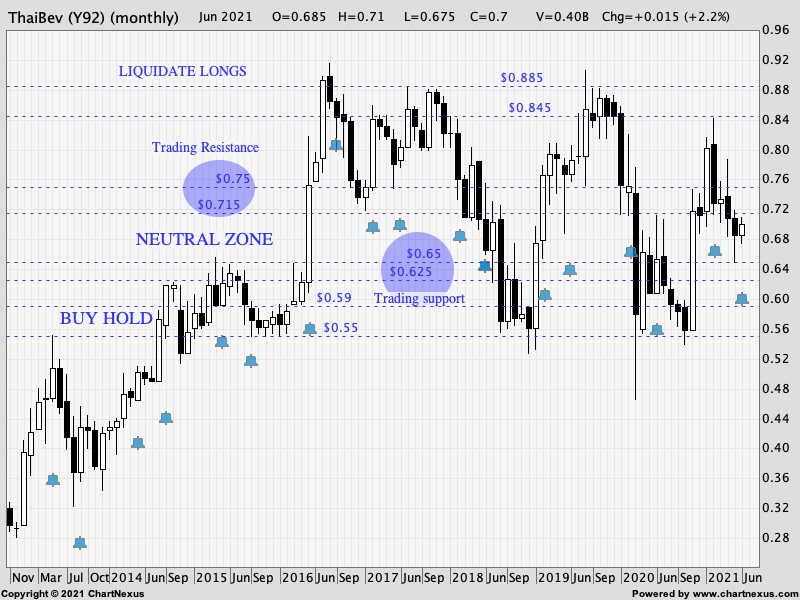
Thai Beverage: Monthly chart
For your reference
I used a few horizontal lines to mark short-term and long-term supports and resistances.
Neutral Zone : 0.62/0.65(supports) to 0.72/0.75(resistances)
For short-term trading can see if can trade within above ranges.
Decent trading buy : 0.65 or below - Decent trading sell 0.75 or higher
Good trading buy : 0.62 or below - Good trading sell 0.78 or higher
Good long-term buy : 0.55 to 0.60 longterm supports
Profits taking area : 0.84 to 0.88 longterm resistances.
All the bre@st
Thanks Sis, haha focus on Dow index futures ok oldlady, me unable to look at 2 or more index futures..
halleluyah ( Date: 22-Jun-2021 10:08) Posted:
|
congratz bro tik tok...infact u can try play ah daq fr swing too, more excited....as usual am havin hapi meal breakfast wth ah seng....
TikTalk ( Date: 22-Jun-2021 08:35) Posted:
|
Ohhh...STI down.banks down....S-ipeh T-erok I-ndeed.
banks down....S-ipeh T-erok I-ndeed.TikTalk ( Date: 21-Jun-2021 21:57) Posted:
|
Usual breakfast with Mr Jones..
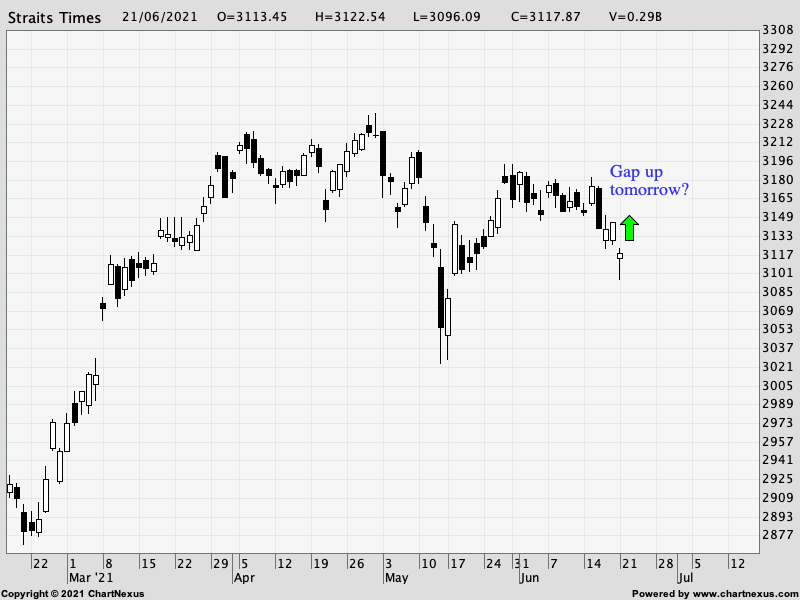
DJIA - Bullish " engulfing pattern"
Credit to Investopedia
Credit to Investopedia
KEY TAKEAWAYS
- A bullish engulfing pattern is a candlestick pattern that forms when a small black candlestick is followed the next day by a large white candlestick, the body of which completely overlaps or engulfs the body of the previous day&rsquo s candlestick.
- Bullish engulfing patterns are more likely to signal reversals when they are preceded by four or more black candlesticks.
- Investors should look not only to the two candlesticks which form the bullish engulfing pattern but also to the preceding candlesticks.
Think Dow likely to close up more than 300 point then tomorrow STI become S-ipeh T-ekong I-ndex, gap up ?
Woooooow from down 200+ to up 200+ ooh up 300 now...
Came here this morn and now again and found the roller shutters are still down and no one around.
Pasted onto the roller shutter is this sign...
.
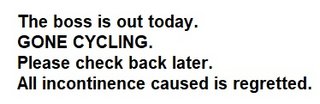

Pasted onto the roller shutter is this sign...
.
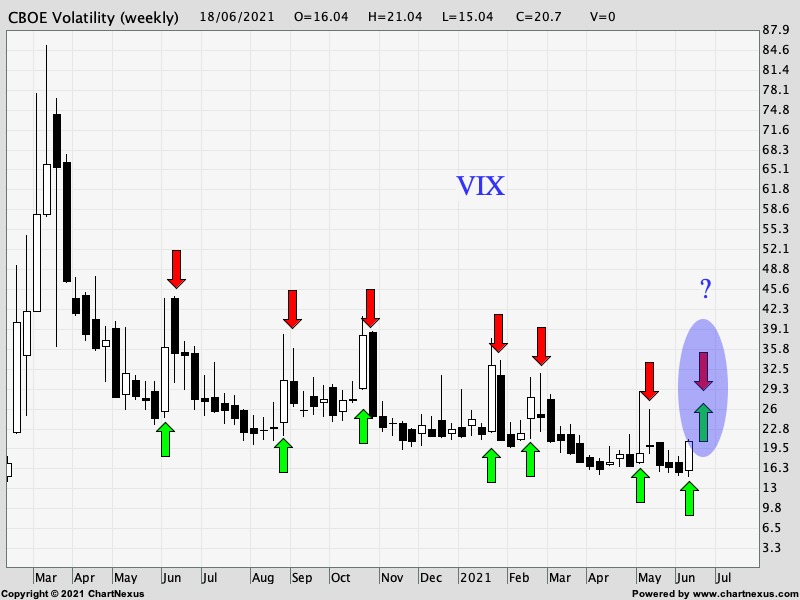
The Fear Index - VIX
Weekly Chart
Another white (green arrow) candle or a black(red arrow) candle next week?
Maybe VIX spike higher if Monday see follow through selling from last Friday..and then market recover through
the week and VIX close lower by coming Friday. Well, just my guess.
All the bre@st
Weekly Chart
Another white (green arrow) candle or a black(red arrow) candle next week?
Maybe VIX spike higher if Monday see follow through selling from last Friday..and then market recover through
the week and VIX close lower by coming Friday. Well, just my guess.
All the bre@st
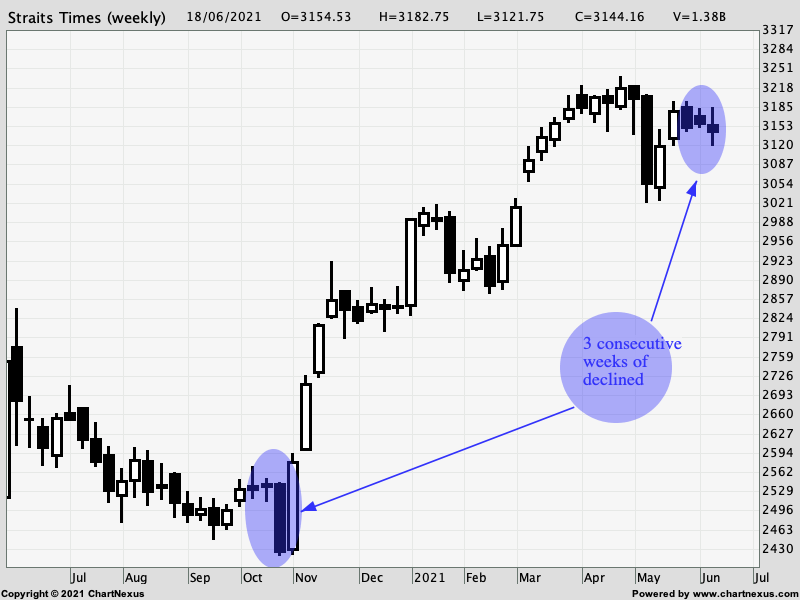
For the first time this year STI had 3 consecutive weeks of declined, S-ipeh T-erok I-ndeed, but not really also.
STI is still up 10% for the year compared to S+P about+10.6%, Dow 8.6% and Nasdaq +8.2% since January.
Sentiments were oldlady weak after Wednesday Fed announcement that 13 of its 18 members think a hike could
come about in 2023 instead of 2024 in previous meeting and this St Louis President James Bullard added oil who
told CNBC on Friday morning he sees a hike by the end of next year.
I think these May and June corrections are healthy and it happen in any uptrending market after big run up.
We will probably see a weaker STI early week and then a rebound later week.
Lets hope for a better July, all the bre@st.