

As I said, there' s a war going on, so it' s difficult to take every message, every story, every reporting at face value. In any case, my posts are meant " to entertain" (depending on how you interpret its meaning)....... I won' t be making any post for the time being, unless I am 100% cock sure the development will happen within a 3 months window period, or I may come in to correct a misconception, juz like the case below......The March 26th transaction is not the same as the March 18th trade, which just didn' t get its own notification. It' t not " fake news" ~ there were just specific reasons why a notification wasn' t required at that time. Here is a simple coffee shop explanation (not written by me hor) to help break it down:
Transaction Timeline for AEM (March 2026 trading transactions)
Based on recent disclosures, JPMorgan (JPM) has been " trading the volatility" of AEM shares ~ buying and selling quickly to capture price swings.
Here' s how their reporting actually works and why some trades (like the 1.225 millions share purchase on 18 March) appear " hidden" at first glance.
The Logic Behind the Disclosures
SGXNet filings can be quite confusing. Here' s why you don' t always see a separate notice for every single trade:
- If JPM buys 1,225,400 units but sells 15,800 units on the same day, the final notification only shows their net resulting interest (e.g., 5.286%), not every individual order.
- A formal Form 3 notice is only required when a shareholder' s total stake crosses the 5% mark or moves by a whole percentage point (like from 5% to 6%).
- Substantial shareholders often bundle multiple trades from a 2-day window into one single filing.
1. The 18 March Transaction & The " Correction"
~ On 18 March 2026, JPM became a substantial shareholder by crossing the 5% threshold (buying 1,225,400 units at SGD 3.72), requiring a SGX update notification
~ While an initial notice went out on 19 March, a Replacement Announcement (Ref: SG260319OTHRECDC) was issued on 20 March. This was a critical correction to ensure the public record accurately reflected the massive 1.2 million unit acquisition from 18 March.
~ However, JPM' s substantial shareholder status was brief. By 19 March, they trimmed their stake back down to 4.9%, meaning they were no longer required to report their daily trades until they hit 5% again.
2. The 26 March Transaction: A Fresh Entry
~ On 26 March, JPM bought 1,794,400 shares for roughly $8.95 million. This pushed their stake from 4.98% back up to 5.18%.
~ Because they crossed that 5% line again, it triggered a brand-new legal requirement to file a disclosure.
~ This trade on 26 March was entirely separate from the earlier 18 March activity.
Anyway, these buy and sell transactions relating to such large institutional investment funds are not so critically significant here, the point I&rsquo m trying to make is ...
It is important to view these disclosures as standard market activity rather than a shift in institutional sentiment. JPMorgan functions as a global investment house, often acting as a custodian or nominee for a wide range of institutional and high-net-worth clients.
Consequently, many of these transactions are client-driven rather than proprietary trades made with JPM' s own capital. When a sale occurs, it typically reflects a client' s decision to take profits, rebalance a portfolio, or reallocate funds to another asset ~ much like a retail trader would ~ rather than a lack of confidence by JPM in the company' s long-term value.
aragosta ( Date: 21-Mar-2026 17:40) Posted:
|
POwer man . JPM increase their share on 26/3.
the coffee uncle sure power.
SGX just annouced the news on 1/4 for the 26/3 transacton
the coffee uncle sure power.
SGX just annouced the news on 1/4 for the 26/3 transacton
aragosta ( Date: 21-Mar-2026 11:32) Posted:
|
1. Purchase 1,942,200 units at average price of SGD 4.49 per unit via market transaction on 26 Mar
2. Decrease of 147,800 units pursuant to the Prime Brokerage Agreement.
https://links.sgx.com/1.0.0/corporate-announcements/IVB7V6C2S469N5MV/881655__eFORM3V2.pdf
2. Decrease of 147,800 units pursuant to the Prime Brokerage Agreement.
https://links.sgx.com/1.0.0/corporate-announcements/IVB7V6C2S469N5MV/881655__eFORM3V2.pdf
The reason why I wrote the following summary when I said I would not post the black market price analysis now, is to ensure that people like the newbies would not to read too much into AEM physical assets and cash position....or trying to use charts to help them make sense of AEM current behavior...... like " how come the price keeps surging?" .....
If you keep focusing on the traditional NAV and PE, you' ll miss the real AEM stoy...... and the plot behind it....
As I said, in this AI era, Intellectual Property is the only real asset that matters...... AEM' s true book value does not sit in its factories or office equipment or cash in the bank it resides in its patented technology, the thermal brain that it pioneered, the industrial bridge through technology partnership that it builds....... In this respect, it simply means that charts and technicals are irrelevant&hellip in short, they are useless....it&rsquo s not like crossing the road where green means go, red means no go.... you' ll get killed crossing like that&hellip &hellip read deeper into what AEM is growing and going into, it' s future growth, it' s forward PE, it' s next horizon.... Charts and technicals tell you the past, it cannot tell you the future in this instance.....that' s why when the syndicates, the gangsters play, they based on their forward instinct and insiders info, never on the shadows and candle stocks beautifully drawn by the analysts..... of course no analyst will tell you that, because charts and TA are their oxygen........ trust me, throw away those circles diagrams and bar charts for this stock, they only mislead you.....
see you in a week!
aragosta ( Date: 29-Mar-2026 17:42) Posted:
|
To trade up to SGD 8.00, we can back out the EPS required at different P/E multiples:
EPS = Price divided by PE
So at Price = 8.00:
| Assumed P/E | Required EPS (SGD) | Notes |
|---|---|---|
| 20x | 0.40 (40¢ ) | Typical for mature semicon peers |
| 25x | 0.32 (32¢ ) | Reasonable premium for AI exposure |
| 30x | 0.27 (27¢ ) | High-growth multiple |
| 40x | 0.20 (20¢ ) | Lofty but possible if AI growth visibility is very strong |
Context
- Current FY25 EPS = 4.35¢ , FY26 = 8.7¢ , FY27 = 17.4¢ .
- At FY27 EPS (17.4¢ ), even at 30x P/E, fair value is ~SGD 5.22 &mdash still below 8.00.
- To justify SGD 8.00, EPS must nearly double again to ~32¢ at a 25x multiple, or ~27¢ at 30x.
Bottom Line
For AEM to trade at SGD 8.00, it would need EPS in the 27&ndash 32¢ range, depending on the multiple the market assigns. That&rsquo s ~1.5&ndash 2x higher than FY27 forecasts, meaning the market would need to believe in sustained explosive growth beyond FY27.
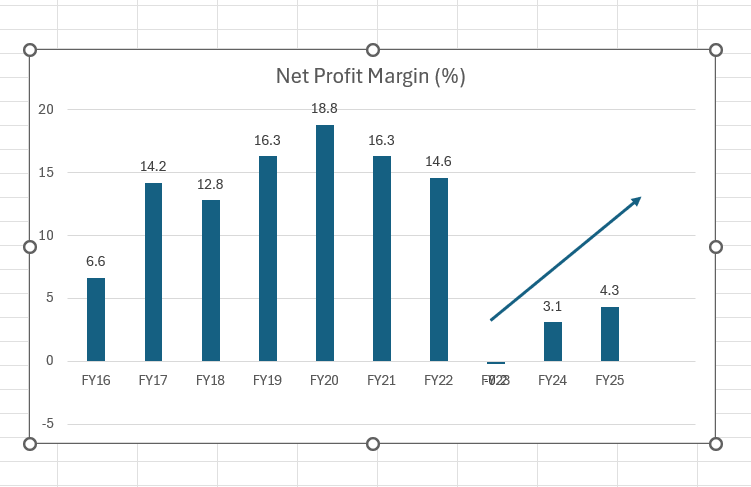
I collated the margins from FY16 to FY25, which was available on the SGX website FY23 shows a negative margin of 0.2%
Observation:
Share price reached its peak of $5.31 on 15 Dec 21 and started its slow descent from 15 Jan 22 when margins started to decrease.
From 15 Jul 22 to 11 Oct 22, share price traded in a range between $4 and $4.60, and traded below $4 thereaafter.
At current price of $4.55, market seems to have already priced in a very strong recovery of net margin to about 14 to 16%
In case there are doubts of a black market report on the possibility of AEM' s price surge to eight, I shall post a snippet of it, a short summary...... but it is to be used for future reference only, because when the No Horse Run truly starts, it will be too late for you to do anything........ believe or unbeliever, don' t blame anyone...... as I said, there' s a war going on, but AEM has shown remarkable resilience in the face of all the ballistic missiles raining on it....... if you don' t know already, that' s the characteristic of a TRULY AI relevant stock.........
==========
The Executive Summary:
Is AEM' s price today " Expensive" or still " Early Days" ?
While the NAV looks high, in the AI era, Intellectual Property is more valuable than physical assets. AEM' s worth isn' t found in its factories or its cash: it is found in the 2,000-watt thermal barrier it has broken, the SLT brain it has perfected, and the Taiwanese Lab-to-Fab bridge it has built. This " Triple-Pillar Moat" , that balance sheets can' t capture, is its true book value.
If AEM can raise its Net Margin from the current ~4% toward the industry standard of 15% to 20%, the $8.00 target isn' t just possible: it' s supported by the same math that drove iFAST to surge from $1 to $10 in under one year.
And here' s the scary part: the black market thinks AEM is " More Valuable" than iFAST on current form. While iFAST' s surge was remarkable, AEM' s structural setup is arguably more robust. AEM possesses significantly more positive drivers than iFAST did at its inflection point
~ iFAST is a platform (it connects people to products).
~ AEM is a bottleneck (the products cannot exist without their tech).
Investors pay much higher P/E multiples for " Bottlenecks" than they do for " Platforms" .
So, in summing up, if you judge AEM by the weight of its physical assets, it looks expensive. If you judge it by its role as the indispensable gatekeeper of the AI supply chain, it is still early days. This isn' t just a hardware play it is the AI Quality-Assurance Standard for the next decade.
dyoddd, please.....
aragosta ( Date: 29-Mar-2026 12:39) Posted:
|
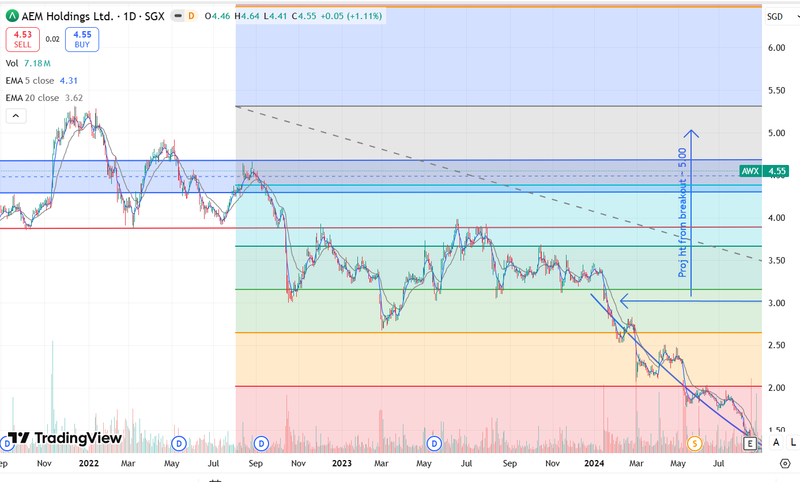
Potential targets based on fibonacci extensions if this bull keeps charging. Of course, it wont move up in a straight line, expect ups an downs along the way.
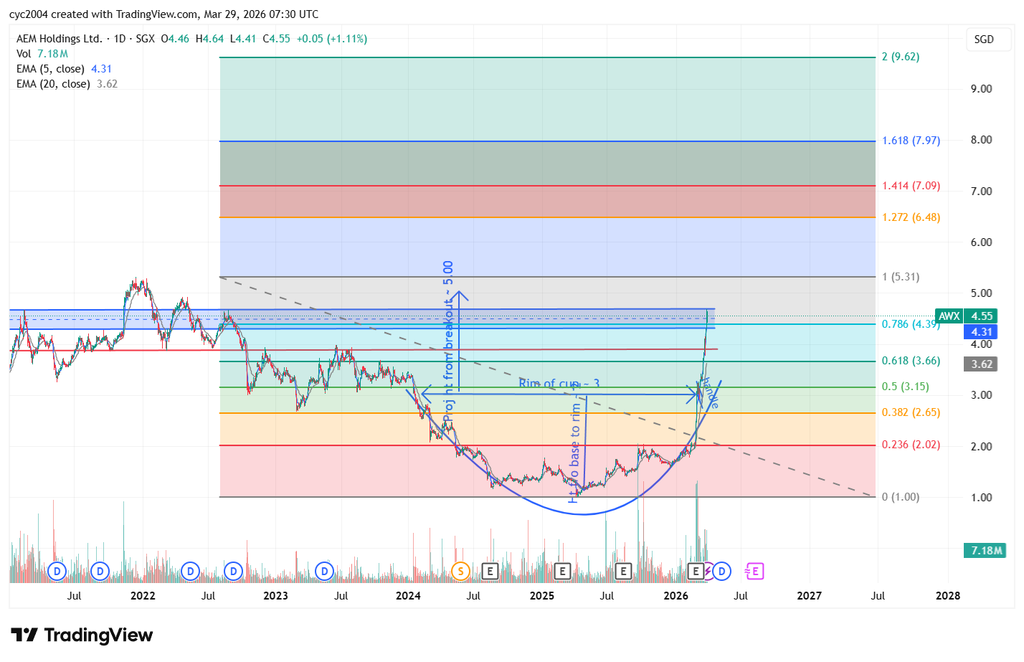
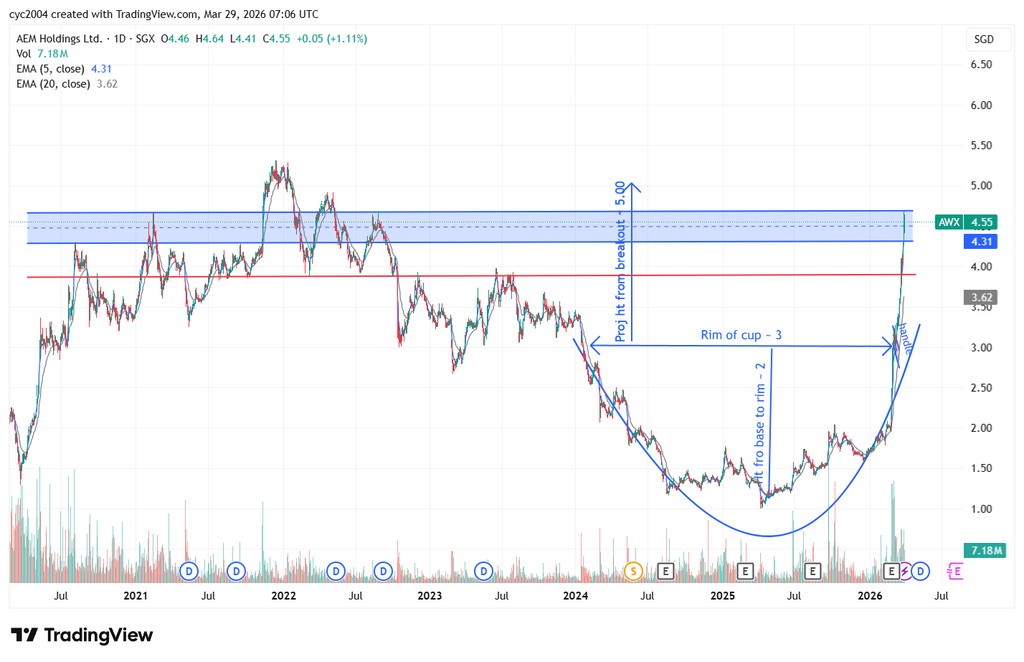
📊 Cup‑ with‑ Handle + Channel Cluster (Revised)
- Cup rim: ~S$3.00
- Cup base: ~S$1.00
- Cup depth: ~S$2.00
- Handle: Small consolidation around S$2.80&ndash 3.00, now resolved.
- Breakout: Confirmed above S$3.00.
- Intermediate resistance cluster (blue channel): S$4.30&ndash 4.66
- Lower edge (~4.30) marks channel support.
- Upper edge (~4.66) marks channel resistance.
- Projected target: Rim (S$3.00) + depth (S$2.00) = S$5.00
🔎 Technical Implications
- Channel dynamics:
- Price is now moving inside a rising channel.
- The 4.30&ndash 4.66 cluster is the key battleground zone.
- Momentum confirmation: Sustained closes above 4.66 would signal strength toward the measured target (~5.00).
- Support flip: 4.30 is now the critical support level holding above it keeps the bullish channel intact.
⚠ ️ Risks & Watchpoints
- Profit‑ taking pressure: Likely near 4.66 and again at 5.00.
- Volume check: Breakout through 4.66 needs strong volume to avoid a false move.
- Failure risk: A drop below 4.30 would break the channel, risking a pullback to ~3.90.
📈 Scenario Calibration
| Scenario | Price Action | Implication |
|---|---|---|
| Bull Case | Breaks above 4.66 with volume | Target ~5.00, possible extension to 5.50&ndash 5.80 |
| Base Case | Consolidates between 4.30&ndash 4.66 | Builds energy, gradual climb |
| Bear Case | Falls below 4.30 | Channel breakdown, retest of 3.90 |
✅ Takeaway
The intermediate resistance cluster is correctly identified as 4.30&ndash 4.66. This zone is now the decisive pivot: holding above 4.30 keeps the bullish channel intact, while clearing 4.66 opens the path to the cup‑ with‑ handle target of ~5.00.
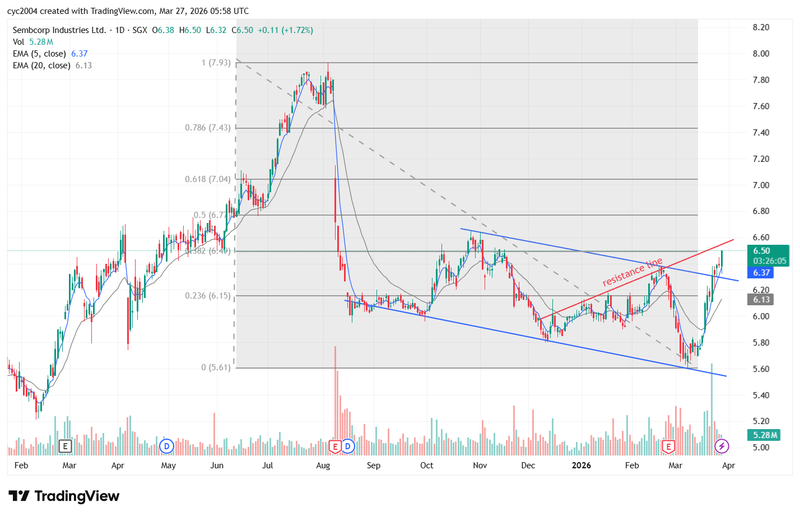
Sembcorp price action is looking good. Once the previous high in Oct and resistance line is taken out, on its way to the region at 0.5 to 0.618 Fibo
aragosta ( Date: 29-Mar-2026 12:39) Posted:
|
I wrote not too long ago, there would be a new development, didn' t knoe it would be so soon..... in any case, I wrote again below, there could be another development, (this is a separate one) and I can confirm this one got nothing to do with a contract win.......
I decided against posting the black market' s lengthy analysis on the possibility of AEM hitting eight, or even the chance of doing an iFAST style of price surge..... But there' s a war going on, with the degree of unpredictability increasing as of now......Like, what if a nuclear bomb is dropped.... besides, I will be travelling.....not forgetting it is not my business to feed the mercenaries......so maybe, some time later..... if there' s interest.......
In any case, my advice to the shortists still remains: do not try to short this stock like it' s your hobby...... all things being equal before the war, the stock would have been half way to the moon by now.......fortunately the AI Boom would mitigate all the negatives of the US/Iran conflict, and so even in the midst of an ugly war, AEM will still look pretty........
Meanwhile, do look out for the unusual movement of Sembcorp......The gangsters are not playing a fool with their numbers...... this could be another surprise packet coming out from the rumbles of the war.......
aragosta ( Date: 25-Mar-2026 17:36) Posted:
|
The New Strategic Map of AEM: Stretching from US to Taiwan
We have another tokkong saying in the Black Market:
" It' s not just WHO your buyers are, but WHERE your buyers are from."
AEM now bridges the two most important zip codes in tech: the United States, the global brain of the semicon industry, where high-value design and software are born, and Taiwan, the ' Silicon Island' that is globally famous for being the unmatched leader in semicon manufacturing. By partnering with both the designers in Silicon Valley and the makers in Silicon Island, AEM is officially where the ideas meet the iron.
AEM has undergone a fundamental transformation in early 2026, transitioning from a company historically reliant on a single US anchor customer (Intel) to a diversified global power in the AI and High-Performance Computing (HPC) testing space. The recent strategic partnership with ASE Technology, the world' s largest Outsourced Semiconductor Assembly and Test (OSAT) provider, marks the validation of AEM' s technology as an industry standard.
1. The Pivot: Beyond the US Big Tech Giants
For years, AEM' s strength lay in its pillar customers from the United States: Intel, Micron, AMD, and Broadcom. While these relationships established AEM' s reputation, the March 2026 partnership with ASE Technology from Taiwan provides the missing link: Global Manufacturing Scale.
a) Geographic Significance: By bridging the gap between US design and Taiwan' s manufacturing dominance, AEM has positioned itself at the heart of the global supply chain.
b) The " Weight" of ASE: ASE serves over 90% of the world' s electronics companies. This partnership provides AEM with a foothold in Taiwan and access to a massive pool of potential new clients.
2. The Twin Pillars of Product Excellence
AEM' s competitive moat is built on two specialized services that are equally critical to the AI revolution:
a) System Level Testing (SLT)
~ The " Brain" : SLT ensures complex AI chips function in real-world environments before shipment.
~ The Value: It is the primary service attracting US tech giants, ensuring long-term customer retention through deep integration into their production cycles.
b) Advanced Cooling: The Life Support for AI
~ The Problem: Extreme Heat: Next-gen AI chips get incredibly hot ~ pumping out as much heat as a large space heater (2,000 watts). Without a way to cool them down instantly, these expensive chips would melt during testing.
~ The Solution: AEM' s PIXL&trade Technology: AEM' s patented system acts like smart air conditioning for a chip. Instead of cooling the whole thing at once, it targets specific hot spotswith different temperatures.
~ The Competitive Edge: This technology is brand new to the market. AEM is currently about one full generation ahead of its main rivals, like Teradyne or Advantest, giving them a massive head start.
3. The Catalytic Value of the ASE Partnership
The collaboration with ASE is more than a sales agreement it is a financial and strategic integration:
~ Financial Alignment: ASE committed to a S$12 million private placement, which could lead to a ~10% ownership stake in AEM.
~ Revenue Triggers: The deal includes 28.1 million warrants tied to hitting revenue milestones of S$30M and S$50M from ASE-introduced business.
~ Synergy: ASE gains the Lab-to-Fab bridge ~ moving chips from engineering labs to high-volume manufacturing faster ~ while AEM gains massive operational scale.
4. The Next Horizon: Driving Revenue Through New Frontier
AEM' s FY2026 revenue guidance (S$460M &ndash S$510M) was issued before the ASE deal was finalized, suggesting a high probability of an upward revision later this year.
a) Customer Diversification: AEM is not sitting still with its historical partners. The company is rapidly pivoting toward the world' s most demanding AI/HPC powerhouses. A second major AI/HPC customer is projected to become AEM' s largest client by the end of 2026, overtaking Intel.
b) Pioneering New Niche Product Frontiers:
AEM' s constantly scouting for untapped technical niches where high-precision testing is a non-negotiable necessity:
~ High-Bandwidth Memory (HBM): AEM is currently validating final test handlers for HBM, the essential backbone of AI servers. This move into the memory market represents a massive new product frontier.
~ Quantum Computing: Looking toward the " next frontier," AEM is already established in cryogenic testing through partnerships with leaders like Bluefors. This positions AEM at the ground floor of the quantum revolution, far ahead of traditional competitors.
c) Unstoppable Momentum and Value Discovery: Despite a stock price increase of over 100% YTD, the market is only beginning to price in AEM' s long-term trajectory. Major analysts continue to raise target prices, citing a massive earnings recovery cycle. This reinforces the view that AEM' s future performance will not be limited by its current market cap or past performance records.
The Weight of the Matter
AEM Holdings has successfully moved from being a specialized equipment supplier to a mission-critical infrastructure provider for the AI era. With its thermal Golden Goose, its new Taiwan-based partnership, and a diversifying client list of global titans, the company is no longer just participating in the market ~ it is helping define its limits.
aragosta ( Date: 22-Mar-2026 14:07) Posted:
|
Quite an exited week last week . Hope to see aragosta sharing soon .
Compute AEM&rsquo s target share price for PEG = 1.5 step by step:
Step 1: PEG formula
PEG = PE divide by Growth Rate
For PEG = 1.5, P/E = 1.5 x Growth Rate
Step 2: Use the growth forecast
- Analysts project AEM&rsquo s earnings growth rate estimate 65%.
- So, the target PE must be: PE = 1.5 x 65 = 97.5
Step 3: Get EPS (Earnings Per Share)
- Forward EPS estimate for AEM &asymp S$0.10.
Step 4: Compute the target share price
Price = PE x EPS
Price = 97.5 x 0.10 = $9.75
Step 5: Compare with current price
- Current trading range: S$3.34&ndash 4.09
- Target for PEG = 1.5: S$9.75
- Meaning: At today&rsquo s price, PEG &asymp 0.5 (undervalued growth).
- If the stock rose to $9.75, PEG would reach 1.5, implying the market is pricing growth at a premium.
📌 Investor calibration takeaway:
- Below S$6.50 &rarr PEG less than 1 &rarr strong growth undervaluation.
- At S$6.50 &rarr PEG = 1 &rarr fair value growth.
- At S$9.75 &rarr PEG = 1.5 &rarr growth is fully priced in, edging toward expensive.
Since the there is interest again. I shall post a series of posts over this weekend including the partnership with ASE Technology whose AEM' s initial issue of shares and WARRANTS to them were viewed as uninteresting by the newbies and promoted by mercenaries as fake negatives ......
Well I hope you all know who Jason Chang is!
I will also post the why coffee shop uncles' eight may not be a joke....... by next month, there will be another TOKKONG development that will be mind blowing , and it has nothing with do with a contract win, or another angmoh pillar clients.......also if you are not lazy to read thru all the gangsters long winded messages, you may be able to spot an alert or two of their speculations ..... I will be also be shifting the furniture of UMS in this thread to its own thread, in anticipation of the next big tech wave.... as I said, believe or unbeliever, up to you.... otherwise, just watch the believers HUAT will do!
AEM is a very STRONG BULL, as long as it doesn' t dip below 5 MA.
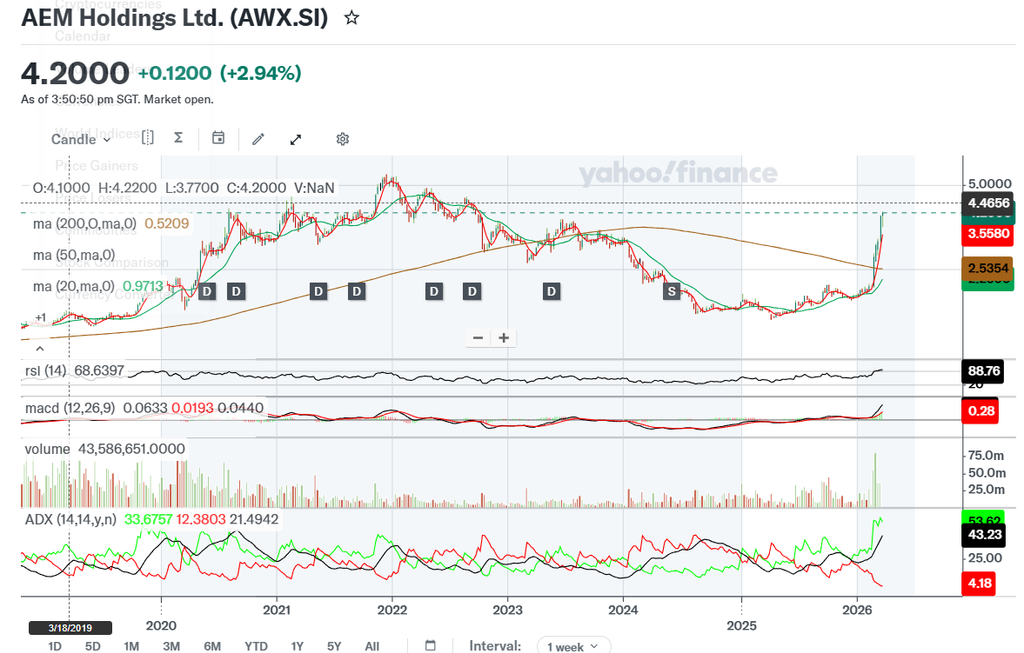
Below report is generated by MSCP for reference. If the figures are wrong, do flag out. Thanks.
Comparative Valuation & Target Prices (FY26&ndash FY27)
| Company | FY26 Forward P/E | FY27 Forward P/E | Latest Target Price | Key Drivers |
|---|---|---|---|---|
| AEM Holdings (SGX:AWX) | Consensus ~15&ndash 17x DBS applies ~25x | ~14&ndash 15x | SGD4.60 (DBS, Mar 2026) | Ramp‑ up of new AI/HPC customer, margin expansion from system‑ level test leadership, recovery post‑ FY25 forex drag. |
| UMS Holdings (SGX:558) | ~23.7x FY26 | ~19.3x FY27 | SGD1.84 (DBS, Jul 2025) | Strong Applied Materials demand, Penang expansion, FY26 net profit forecast +30% y/y, FY27 +23% y/y. |
| Frencken Group (SGX:E28) | ~22.5x FY26 | ~20.1x FY27 | SGD2.50 (DBS, Mar 2026 median TP across brokers) | Semiconductor recovery from 2H26, resilient medical/automation demand, diversified end‑ markets. |
🔎 Key Insights
- AEM: Consensus multiples are cheapest (~15&ndash 17x), but DBS&rsquo s bullish case (SGD4.60 TP) assumes re‑ rating to ~25x forward P/E if the AI/HPC ramp delivers.
- UMS: Most expensive on forward multiples, reflecting strong Applied Materials exposure and consistent earnings growth.
- Frencken: Valuation sits between AEM and UMS, offering diversified resilience but not commanding UMS‑ like premiums.
⚖ ️ Investor Takeaway
- Cheapest Growth Play &rarr AEM (consensus multiples low, upside if DBS&rsquo s bullish case materializes).
- Premium Stability &rarr UMS (highest multiples, justified by strong client demand and growth visibility).
- Middle Ground &rarr Frencken (resilient margins, diversified demand, moderate valuation).
👉 With these fresh figures, you can confidently share that UMS is the most expensive (~23.7x FY26, ~19.3x FY27), Frencken sits mid‑ range (~22.5x FY26, ~20.1x FY27), and AEM is cheapest on consensus (~15&ndash 17x), though DBS&rsquo s SGD4.60 TP implies a bullish re‑ rating to ~25x.
Good point, but has AEM reached maximum optimism before the selling appears, or Does it still have the legs to chiong further ?
All will find out this week.

sgtrader ( Date: 22-Mar-2026 14:34) Posted:
|
Analysis and Comparison of AEM and ST engineering valuations based on their forward earnings.
Based on current analyst forecasts, ST Engineering (STE) looks more expensive than AEM on FY26&ndash FY27 earnings multiples, with STE trading at ~23x forward P/E versus AEM mid‑ teens valuation range. AEM growth is expected to accelerate from FY26 onwards, while STE valuation premium reflects its diversified, resilient earnings base.
📊 Valuation Comparison: AEM vs ST Engineering (FY26&ndash FY27)
| Company | FY26 Forecast | FY27 Forecast | Valuation Notes |
|---|---|---|---|
| AEM Holdings (SGX:AEM) | Earnings recovery expected as new customer ramps (Intel, AI test solutions). Analysts project strong FY26 rebound after flat FY25. Forward P/E estimated ~15&ndash 17x. | Continued growth into FY27 with margin expansion from system‑ level test leadership. Valuation remains below STE, suggesting cheaper relative multiple. | Market cautious due to cyclical semiconductor demand, but upside tied to AI/IoT megatrends. |
| ST Engineering (SGX:S63) | Strong revenue growth across aerospace, defence, and urban solutions. FY26 forward P/E around ~23x. | FY27 earnings visibility supported by robust order book, but valuation premium persists. Dividend payout policy (1/3 of earnings growth) adds support. | Considered &ldquo expensive&rdquo relative to peers, but investors pay for stability and diversified earnings streams. |
🔎 Key Insights
-
AEM:- FY25 is transitional, with earnings weighed down by forex losses and muted growth.
- FY26&ndash FY27 expected to deliver strong gains as new customers ramp up and margins expand.
- Valuation sits in the mid‑ teens P/E range, making it cheaper than STE.
- Risk: Semiconductor cycle volatility and dependence on Intel orders.
-
ST Engineering:- Diversified across aerospace, defence, and smart city solutions, giving resilience.
- Analysts highlight efficiency improvements and dividend growth, but valuation is steep at ~23x forward P/E.
- Investors pay a premium for stability and visibility, but relative to AEM, STE is more expensive.
⚖ ️ Trade‑ Offs
- AEM offers higher growth potential at a lower valuation, but carries cyclical risk.
- STE commands a premium valuation due to stability, dividends, and diversified earnings, but upside may be capped by already high multiples.
👉 Bottom Line: If you&rsquo re looking for growth at a reasonable price, AEM is cheaper on FY26&ndash FY27 earnings forecasts. If you prefer defensive stability with dividends, ST Engineering justifies its higher valuation but is clearly more expensive relative to AEM.
When everyone is too bullish, it' s time to take profits...