| Latest Forum Topics / Trading Techniques |
|
|
Shen Yao (Miracle Medicine?): New Beginning!
|
|||||
|
TikTalk
Supreme |
05-Mar-2021 13:09
|
||||
|
x 0
x 0 Alert Admin |
.3024.29...can sustain bo?
|
||||
| Useful To Me Not Useful To Me | |||||
|
TikTalk
Supreme |
05-Mar-2021 12:33
|
||||
|
x 0
x 0 Alert Admin |
So, today STI high so far 3020.89, it has registered a new high, which means it is saying the uptrend since March is intact. People are willing to pay higher prices so it goes higher, if no one willing to pay Brompton 3k for a bike the company would have already closed down long ago lo.  And why le why le Dow last night koyak how can STI make new high war??? Dow futures recovering for a short answer..but Dow like prata if follow too closely..is inflation fear overblown le? tiktalk again later eating lunch soon.
|
||||
| Useful To Me Not Useful To Me | |||||
|
|
|||||
|
TikTalk
Supreme |
05-Mar-2021 11:30
|
||||
|
x 0
x 0 Alert Admin |
Why Dow kar loud 300+ but STI only a few points lower? | ||||
| Useful To Me Not Useful To Me | |||||
|
TikTalk
Supreme |
05-Mar-2021 10:14
|
||||
|
x 0
x 0 Alert Admin |
Buy Brompton la.....save 2k in the bank are just pieces of useless paper money if not spend.
|
||||
| Useful To Me Not Useful To Me | |||||
|
TikTalk
Supreme |
05-Mar-2021 08:27
|
||||
|
x 0
x 0 Alert Admin |
Rising interest rates good for STI? https://www.macrotrends.net/2015/fed-funds-rate-historical-chart See above historical fed funds and compare them to STI index, fed funds rate start to rise in early 2004 till 2007 and STI rallied war till 2007. In 2015 when fed funds rate rises STI also bottomed in 2016 and rallied till 2018 also war. In early 1990s rate rise but I dont have the STI charts so can someone verify STI also up during those few years? If so, in the last 3 rising interest rate cycle STI kee le.  Friends of TF lets research and tiktalk again  |
||||
| Useful To Me Not Useful To Me | |||||
|
|
|||||
|
TikTalk
Supreme |
05-Mar-2021 07:58
|
||||
|
x 0
x 0 Alert Admin |
up down up down until kong kong
|
||||
| Useful To Me Not Useful To Me | |||||
|
TikTalk
Supreme |
04-Mar-2021 23:39
|
||||
|
x 0
x 0 Alert Admin |
Now going green again..lol
|
||||
| Useful To Me Not Useful To Me | |||||
|
TikTalk
Supreme |
04-Mar-2021 22:40
|
||||
|
x 0
x 0 Alert Admin |
Oh...Dow up almost 200 liao lor
|
||||
| Useful To Me Not Useful To Me | |||||
|
|
|||||
|
TikTalk
Supreme |
04-Mar-2021 22:38
|
||||
|
x 0
x 0 Alert Admin |
huat ar...
|
||||
| Useful To Me Not Useful To Me | |||||
|
TikTalk
Supreme |
04-Mar-2021 17:26
|
||||
|
x 0
x 0 Alert Admin |
STI closed 3014.78 Can STI sustain above 3000?
|
||||
| Useful To Me Not Useful To Me | |||||
|
TikTalk
Supreme |
04-Mar-2021 16:21
|
||||
|
x 0
x 0 Alert Admin |
Or also need the monkey according to bro wave
|
||||
| Useful To Me Not Useful To Me | |||||
|
TikTalk
Supreme |
04-Mar-2021 16:18
|
||||
|
x 0
x 0 Alert Admin |
Below 2.80 for longs it?s in my message
|
||||
| Useful To Me Not Useful To Me | |||||
|
|
|||||
|
TikTalk
Supreme |
04-Mar-2021 15:33
|
||||
|
x 0
x 0 Alert Admin |
Yes if one can see what I see after rally it corrected to the 3 ma lines just like in May 2019...you see those 3 ma lines are exactly converging in the same manner in May 2019, thereafter cheong after they cross over. The red line has crossed over the green if continue rising will cross over the dark ma line. For it to happen you need the fundamental or the catalyst Luzern mentioned.
|
||||
| Useful To Me Not Useful To Me | |||||
|
TikTalk
Supreme |
04-Mar-2021 15:23
|
||||
|
x 0
x 0 Alert Admin |
Allow me to kapo on AR Immediate short term trend is down, see 9ma has been the resistance, 20ma sloping downward, trading below 200m(long trend in question) thus prices are consolidating ever since the sell off from its high, now we are nearer to lower band of consolidation. Daily MACD and DMI suggest near term weakness bias. $2.80 critical support(long need to have a stop below this on a closing basis). If support hold then it may either continue to consolidate between 2.80/85 to 3.12/18 or gradually mover higher and break resistane at 3.12/3.18 can gain upward momentum toward 3.30/3.35 area. Can trade anot? Why not, if buy below 2.90 with a 10cts risk maybe can make around 15 cts, if break 3.12/3.18 then hosay. But hor you must know if you buying for short term or long term, and always have exit plan otherwise can become wrong term hor. I will just trade within those range mentioned above if I want to be involve in AR. No need to care up or down trend. Only care if you make or lose buying or selling...hehehetiktalk again. |
||||
| Useful To Me Not Useful To Me | |||||
|
TikTalk
Supreme |
04-Mar-2021 13:24
|
||||
|
x 0
x 0 Alert Admin |
STI 3014
|
||||
| Useful To Me Not Useful To Me | |||||
|
TikTalk
Supreme |
04-Mar-2021 11:48
|
||||
|
x 0
x 0 Alert Admin |
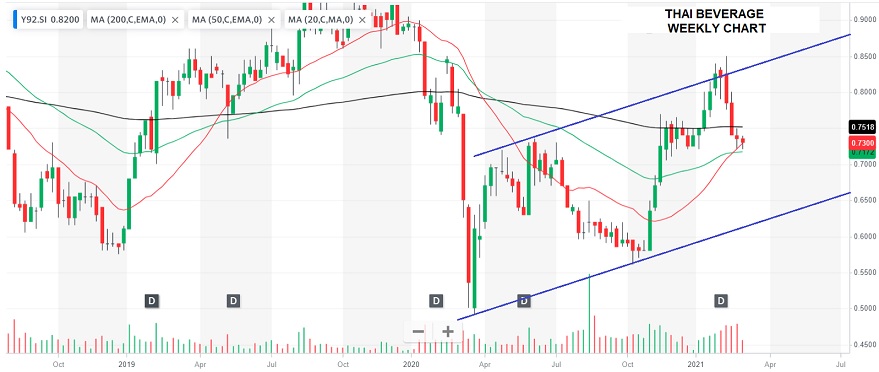
Below analysis was base on daily chart, the weekly chart bring me back to a somewhat similar picture back in May 2019 whereby it held the low then and climbed gradually to make new highs. ( I dunno how to upload charts and old dog doesnt want to learn new tricks here.) Therefore if TB can hold 0.705 and with strong fundamentals cannot rule out a continuation of its uptrend since March low to make new highs in coming months or year ahead.
|
||||
| Useful To Me Not Useful To Me | |||||
|
TikTalk
Supreme |
04-Mar-2021 11:20
|
||||
|
x 0
x 0 Alert Admin |
If I may add on my little TA....key support between 0.705 to 0.715 to watch as a break below may lead to further downside momentum, meaning the queue to sell will get longer limiting each bounce. However the 200ma is around 0.68 and thats another support to watch. Upside resistance 0.765/0.77 where the 20ma and 50ma has just crossed recently and sloping downward, therefore the current short term trend is down. If support hold upside potential limited to those resistance I mentioned or in othe words the 20 & 50ma will be resistances. I could be wrong tho on my TA. Ok tiktalk again next time.
|
||||
| Useful To Me Not Useful To Me | |||||
|
TikTalk
Supreme |
04-Mar-2021 10:46
|
||||
|
x 0
x 0 Alert Admin |
STI Index: High 2839.39 on 9th June High 2920.55 on 25th Nov 2020 High 3017.15 on 21st Jan 2021(A break above 21st Jan high would register another higher high, meaning the uptrend remain intact, currently as of this writing is at 3003 thereabout. Low 2208.42 on 23rd March 2020 Higher low 2420.84 on 30 Oct 2020(unless we make a lower low below here the uptrend remain intact. Moving averages: During Dec 2020 and Feb 2021 consolidation STI did dip below it 20ma but each time it has gone back above the 20ma and recently the ma is turning up again. 200ma has been sloping downward till Dec 2020 it flatten out and from Jan 2021 it started to turn upward till today. I look at the slope of the ma as a visual reminder of a trend, slope upward bullish, slope downward bearish. will tiktalk further whenever I have something to share.... |
||||
| Useful To Me Not Useful To Me | |||||
|
TikTalk
Supreme |
04-Mar-2021 10:05
|
||||
|
x 0
x 0 Alert Admin |
Last night US down but STI today up...wow
|
||||
| Useful To Me Not Useful To Me | |||||
|
TikTalk
Supreme |
03-Mar-2021 21:38
|
||||
|
x 0
x 0 Alert Admin |
Oh Dow future from +200 now +35
|
||||
| Useful To Me Not Useful To Me | |||||