


| Latest Forum Topics / Insider Info/Tips |
|
|
ISDN
|
|||||
|
baicho
Senior |
24-Apr-2026 09:52
|
||||
|
x 0
x 0 Alert Admin |
As long as Daily Pivot Support Close is 0.45 is not violated to date, ISDN price action has room for a potential to grind up higher in due course as there is a technical long term uptrend shift in upside sentiment and momentum.
|
||||
| Useful To Me Not Useful To Me | |||||
|
baicho
Senior |
23-Apr-2026 17:44
|
||||
|
x 0
x 0 Alert Admin |
TECHNICAL ANALYSIS OF ISDN AS ON 23TH APRIL 2026 A) Daily Short Term Pivot Support Close at 0.45. B) End Weekly Intermediate Term Pivot Support Close at 0.365. C) End Monthly Long Term Pivot Support Close at 0.275. TECHNICAL SYNOPSIS As long as ISDN Daily Short Term Pivot Support Close at 0.45 is not violated to date, its daily price action has the potential of testing minimum overhead resistance zone between 0.55 and 0.62 before profit taking selling may surface. Breaking and closing below its Daily Short Term Pivot Support Close at 0.45 may portend ISDN daily price action to test its End Weekly Intermediate Pivot Support Close at 0.365. As long as ISDN does not close below its End Weekly Intermediate Support Close at 0.365, there is a high probability that the most recent low of 0.335 may be well supported and becomes its consolidated low to date. But if ISDN closes below its End Weekly Intermediate Pivot Support Close at 0.365, its price action may potentially break its most recent support low of 0.335 and test its downside of its End Monthly Long Term Pivot Support Close at 0.275. Closing below 0.275 may portend very much lower price action. Due diligence is warranted. | ||||
| Useful To Me Not Useful To Me | |||||
|
|
|||||
|
ysh2006
Supreme |
23-Apr-2026 11:06
|
||||
|
x 0
x 1 Alert Admin |
If public think AI and robertic business are good than can sustained the uptrend and break the resistance 54.5c....else will drop back 42c
|
||||
| Useful To Me Not Useful To Me | |||||
|
baicho
Senior |
23-Apr-2026 10:07
|
||||
|
x 0
x 0 Alert Admin |
That?s not a neutral open ? it?s an aggressive breakout attempt with momentum behind it. But the details matter. What your numbers are saying: Open = 0.50 (key level) Low = 0.50 → no selling pressure below open High = 0.545 → strong push up (+9%) Volume = 8.57 Million shares traded → heavy participation This forms an intraday bullish drive (opening drive / momentum candle). Technical implications: 1) Strong breakout from 0.50 0.50 was acting like resistance / psychological level Opening at 0.50 and never dipping below = 👉 sellers at 0.50 got absorbed immediately. Push to 0.545 confirms buyers in control Implication: ➡ ️ Short-term trend has turned bullish 2) ?Open = Low? pattern (very important) This is a classic bullish intraday structure: Market opens → buyers step in immediately → price never revisits open Meaning: Institutions / strong hands likely involved. Not typical weak retail chasing 3) Volume confirmation 7.2M shares early session is significant vs normal flow. If volume continues expanding: Confirms real breakout (not fake) If volume fades: Risk of intraday blow-off / profit taking Key levels to watch next: Support: 0.52 → short-term support 0.50 → critical breakout level (must hold) Resistance: 0.545 → current intraday high 0.55 → psychological + breakout extension 0.58?0.60 → next supply zone (if momentum continues) Scenarios going forward Bullish continuation (best case) Holds above 0.52 Breaks 0.545 with volume 👉 Then: Likely push to 0.55 → 0.58 Intraday pullback (healthy) Pulls back to 0.52?0.50 Holds and stabilizes. 👉 Still bullish structure (just consolidation) Bearish trap (watch out) Fails back below 0.50 👉 Then: This becomes a false breakout Could drop fast back to 0.47?0.48 Bottom line Short-term bias: Bullish Structure: Strong (open = low, high volume). Due diligence is warranted. | ||||
| Useful To Me Not Useful To Me | |||||
|
JurongW
Elite |
23-Apr-2026 09:50
Yells: "Earnings give weight, Chart give wings" |
||||
|
x 1
x 0 Alert Admin |
Share price respecting the resistance at R2 when it went up as high as 54.5 Now 50.5/51 below R1 - Profit taking setting in ?
|
||||
| Useful To Me Not Useful To Me | |||||
|
|
|||||
|
baicho
Senior |
23-Apr-2026 09:26
|
||||
|
x 0
x 0 Alert Admin |
Wow, strong buying probably by institutions.
|
||||
| Useful To Me Not Useful To Me | |||||
|
baicho
Senior |
22-Apr-2026 19:17
|
||||
|
x 0
x 0 Alert Admin |
🧠 Bottom line of today's closing price action after the auction close:
This is not random closing action.
👉 It?s controlled absorption + strong close under resistance of 0.50
which usually means:
Buyers are preparing to take 0.50 ? not finished yet.
Due diligence is warranted.
|
||||
| Useful To Me Not Useful To Me | |||||
|
baicho
Senior |
22-Apr-2026 18:14
|
||||
|
x 0
x 0 Alert Admin |
Given ISDN's today's trading datas ( Open 0.42, High 0.50, Low 0.42, Close 0.495) with traded volume of 25,673 shares (which is high vs ISDN?s usual volume), this actually tells a pretty clear story: 📊 What the candle likely looks like Very long lower shadow (0.42→ near 0.50) Close almost at the high (0.495 vs 0.50) Wide intraday range (~19%) This resembles a bullish pattern strong close. 🔎 Interpretation (Price Action) 1. Strong dip-buying / accumulation. Price opened strongly at 0.42. Buyers stepped in aggressively Closed near the high → sellers lost control 👉 This is classic ?absorption? of selling pressure. 2. Bullish continuation bias (not just reversal) Because: Close is near day?s high Volume is very high. 👉 This is not weak rebound ? it?s aggressive accumulation. 3. Key levels now Immediate resistance: 0.50 Break above 0.50 → momentum breakout. Support formed: ~0.46?0.47 (mid-body area) Strong support: 0.42 (today?s low) This kind of candle can also mean: ?Shakeout? before breakout (bullish) OR ?distribution at the top? (less likely, but possible) How to tell next: 👉 Next 1?2 trading sessions are critical If price breaks 0.50 with volume → strong continuation (likely trend up) If price fails and drops below ~0.47 → possible bull trap. 📈 Volume context (very important) If 25M+ shares is: 2?3× average volume → institutional activity likely Not just retail → smart money involvement. 🧠 Bottom line Short-term signal: Bullish Pattern type: Long lower wick / hammer-like with strong close Implication: 👉 Buyers in control 👉 High chance of testing / breaking 0.50 next. Due diligence is warranted. | ||||
| Useful To Me Not Useful To Me | |||||
|
|
|||||
|
JurongW
Elite |
22-Apr-2026 17:04
Yells: "Earnings give weight, Chart give wings" |
||||
|
x 1
x 0 Alert Admin |
For reference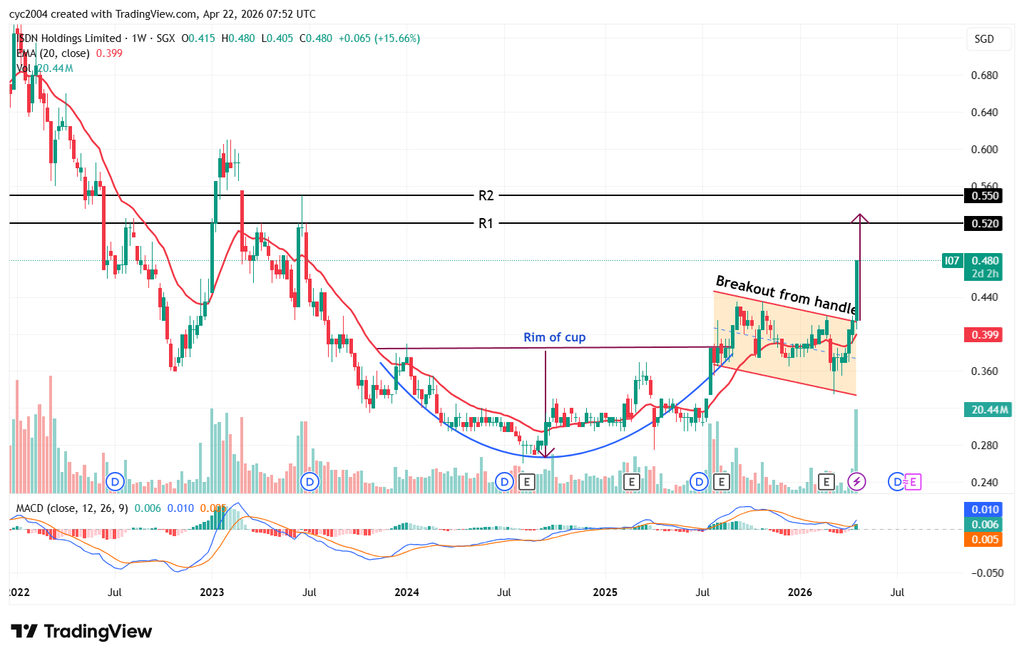
|
||||
| Useful To Me Not Useful To Me | |||||
|
baicho
Senior |
22-Apr-2026 16:18
|
||||
|
x 0
x 0 Alert Admin |
TECHNICAL ANALYSIS OF ISDN AS ON 22TH APRIL 2026 A) Daily Short Term Pivot Support Close at 0.40. B) End Weekly Intermediate Term Pivot Support Close at 0.35. C) End Monthly Long Term Pivot Support Close at 0.27. TECHNICAL SYNOPSIS As long as ISDN Daily Short Term Pivot Support Close at 0.40 is not violated to date, its daily price action has already broken previous high of 0.435 on big volume with the potential of testing minimum 0.55 to 0.62 zone before facing profit taking selling. Breaking and closing below its Daily Short Term Pivot Support Close at 0.40, may portend ISDN daily price action to test its End Weekly Intermediate Pivot Support Close at 0.35. As long as ISDN does not close below its End Weekly Intermediate Support Close at 0.35, there is a high probability that the most recent low of 0.335 may be well supported and becomes its consolidated low to date. But if ISDN closes below its End Weekly Intermediate Pivot Support Close at 0.35, its price action may potentially break its most recent support low of 0.335 and test its downside of its End Monthly Long Term Pivot Support Close at 0.27. Closing below 0.27 may portend very much lower price action. Due diligence is warranted. | ||||
| Useful To Me Not Useful To Me | |||||
|
baicho
Senior |
22-Apr-2026 10:55
|
||||
|
x 0
x 0 Alert Admin |
TECHNICAL ANALYSIS OF ISDN AS ON 22TH APRIL 2026 A) Daily Short Term Pivot Support Close at 0.39. B) End Weekly Intermediate Term Pivot Support Close at 0.35. C) End Monthly Long Term Pivot Support Close at 0.27. TECHNICAL SYNOPSIS As long as ISDN Daily Short Term Pivot Support Close at 0.39 is not violated to date, its daily price action has already broken previous high of 0.435 with the potential of testing minimum 0.50 zone before facing profit taking selling. Breaking and closing below its Daily Short Term Pivot Support Close at 0.39, may portend ISDN daily price action to test its End Weekly Intermediate Pivot Support Close at 0.35. As long as ISDN does not close below its End Weekly Intermediate Support Close at 0.35, there is a high probability that the most recent low of 0.335 may be well supported and becomes its consolidated low to date. But if ISDN closes below its End Weekly Intermediate Pivot Support Close at 0.35, its price action may potentially break its most recent support low of 0.335 and test its downside of its End Monthly Long Term Pivot Support Close at 0.27. Due diligence is warranted. Closing below 0.27 may portend very much lower price action. Due diligence is warranted. | ||||
| Useful To Me Not Useful To Me | |||||
|
ahberngh
Elite |
22-Apr-2026 09:57
|
||||
|
x 1
x 0 Alert Admin |
Kudos to your daily analysis on ISDN. But, may I suggest you keep it brief and well spaced for easier reading. I look at the whole chunk of closely spaced words in your daily anaylsis and skip it. Sorry, no intention to offend, just my opinion.
|
||||
| Useful To Me Not Useful To Me | |||||
|
|
|||||
|
baicho
Senior |
22-Apr-2026 09:44
|
||||
|
x 0
x 0 Alert Admin |
Now Mr Market van look much deeper and more precise on ISDN?because the actual JV details just came out today, and they explain exactly why the stock moved. 🔥 ISDN JV ? The REAL story (not generic) This is not just a ?robotics JV?. 👉 It is: A spin-off + dilution + strategic upgrade A geopolitical positioning play (anti-China supply chain) A high-risk, high-upside venture bet 🧩 What exactly happened (important structure) ISDN sold down its robotics unit (AR Robotics) New ownership: ISDN → 30% Japanese partner (Soradynamics) → 30% Financial partner (Trinity) → 40% � Minichart 👉 This is key: ISDN no longer controls the business 🧠 What the Japanese partner brings Soradynamics contributes: Drone robotics tech Multi-camera AI / video fusion systems � 👉 This is not basic factory robots This is AI-enabled drone robotics platform Use cases: Inspection (buildings, infra) Firefighting Surveillance Delivery � 💰 The part that moved the stock (VERY important) ✅ Immediate pipeline exists ~USD 10 million contracts already � 👉 This is why price spiked: Not just story There is real revenue visibility ✅ Macro tailwind (big money theme) Shift away from Chinese robotics Demand for non-China supply chain rising � 👉 This is HUGE: Western + Asian buyers want alternatives Japanese tech + Singapore base = trusted combo ⚖ ️ But here?s the part most retail misses ❗ ISDN gave up control They now own only 30% 👉 So: Revenue contribution = equity accounting, not full consolidation Profit impact = slower, smaller initially ❗ Capital injection is tiny Only S$1M seed capital � Minichart 👉 Translation: Still early-stage venture Not moving group earnings immediately 📊 So what does this mean for valuation? 🔹 Short term (what you're trading now) Market is pricing: Growth story Robotics re-rating Non-China theme 👉 That explains 0.425 → 0.445 breakout 🔹 Medium term (next 2?3 quarters) Stock will depend on: Conversion of USD10M pipeline into revenue. 🔹 Long term (THIS is the real bet) If successful: ISDN transforms from: Industrial distributor → Deep-tech platform company This is exactly what they are trying: Robotics (AR Robotics) AI inspection (NovaPeak + Panasonic partnership) � 👉 Pattern is clear: They are building a portfolio of tech ventures. Implication: Real contracts already (not empty JV) Strong Japanese tech Riding global supply chain shift Opens US/EU markets. Based on catalyst strength + structure: Immediate resistance: 0.46?0.48 Momentum breakout: 0.50 Pullback support: 0.42?0.425 👉 If more contract news comes: 0.50 is achievable 🧭 My honest conclusion (no hype) This JV is: 👉 Strategically strong 👉 Financially early-stage 👉 Stock-wise: story-driven for now. Due diligence is warranted. | ||||
| Useful To Me Not Useful To Me | |||||
|
baicho
Senior |
22-Apr-2026 09:15
|
||||
|
x 0
x 0 Alert Admin |
Wow, big volume today at break out point of 0.425. Let's hope this week, previous high of 0.435 can be broken upwards and sustain.
|
||||
| Useful To Me Not Useful To Me | |||||
|
JurongW
Elite |
21-Apr-2026 19:05
Yells: "Earnings give weight, Chart give wings" |
||||
|
x 1
x 0 Alert Admin |
Let' s see how share price react to this news tomorrow. < Not Vested>
|
||||
| Useful To Me Not Useful To Me | |||||
|
PQTPQK
Supreme |
21-Apr-2026 18:50
|
||||
|
x 1
x 0 Alert Admin |
Good piece of new!
|
||||
| Useful To Me Not Useful To Me | |||||
|
JurongW
Elite |
21-Apr-2026 18:17
Yells: "Earnings give weight, Chart give wings" |
||||
|
x 1
x 0 Alert Admin |
ISDN&rsquo s subsidiary AR Robotics brings in Soradynamics and Trinity as strategic partners to drive robotics and AI business https://links.sgx.com/1.0.0/corporate-announcements/G88YK1BGJMNH21MH/884914_eISDN_AR%20Robotics.pdf |
||||
| Useful To Me Not Useful To Me | |||||
|
baicho
Senior |
21-Apr-2026 17:19
|
||||
|
x 0
x 0 Alert Admin |
TECHNICAL ANALYSIS OF ISDN AS ON 20TH APRIL 2026 A) Daily Short Term Pivot Support Close at 0.375. B) End Weekly Intermediate Term Pivot Support Close at 0.35. C) End Monthly Long Term Pivot Support Close at 0.27. TECHNICAL SYNOPSIS As long as ISDN Daily Short Term Pivot Support Close at 0.375 is not violated to date, its daily price action may have the potential to grind up higher to test its previous high of 0.435 and possibly breaking above it. Breaking and closing below its Daily Short Term Pivot Support Close at 0.375, may portend ISDN daily price action to test its End Weekly Intermediate Pivot Support Close at 0.35. As long as ISDN does not close below its End Weekly Intermediate Support Close at 0.35, there is a high probability that the most recent low of 0.335 may be well supported and becomes its consolidated low to date. But if ISDN closes below its End Weekly Intermediate Pivot Support Close at 0.35, its price action may potentially break its most recent support low of 0.335 and test its downside of its End Monthly Long Term Pivot Support Close at 0.27. Closing below 0.27 may portend very much lower price action. Due diligence is warranted. | ||||
| Useful To Me Not Useful To Me | |||||
|
baicho
Senior |
20-Apr-2026 17:35
|
||||
|
x 0
x 0 Alert Admin |
TECHNICAL ANALYSIS OF ISDN AS ON 20TH APRIL 2026 A) Daily Short Term Pivot Support Close at 0.375. B) End Weekly Intermediate Term Pivot Support Close at 0.35. C) End Monthly Long Term Pivot Support Close at 0.27. TECHNICAL SYNOPSIS As long as ISDN Daily Short Term Pivot Support Close at 0.375 is not violated to date, its daily price action may have the potential to grind up higher to test its previous high of 0.435 and possibly breaking above it. Breaking and closing below its Daily Short Term Pivot Support Close at 0.375, may portend ISDN daily price action to test its End Weekly Intermediate Pivot Support Close at 0.35. As long as ISDN does not close below its End Weekly Intermediate Support Close at 0.35, there is a high probability that the most recent low of 0.335 may be well supported and becomes its consolidated low to date. But if ISDN closes below its End Weekly Intermediate Pivot Support Close at 0.35, its price action may potentially break its most recent support low of 0.335 and test its downside of its End Monthly Long Term Pivot Support Close at 0.27. Closing below 0.27 may portend very much lower price action. Due diligence is warranted. | ||||
| Useful To Me Not Useful To Me | |||||
|
baicho
Senior |
17-Apr-2026 22:47
|
||||
|
x 0
x 0 Alert Admin |
TECHNICAL ANALYSIS OF ISDN AS ON 17TH APRIL 2026 A) Daily Short Term Pivot Support Close at 0.375. B) End Weekly Intermediate Term Pivot Support Close at 0.35. C) End Monthly Long Term Pivot Support Close at 0.27. TECHNICAL SYNOPSIS As long as ISDN Daily Short Term Pivot Support Close at 0.375 is not violated to date, its daily price action may have the potential to grind up higher to test its previous high of 0.435 and possibly breaking above it. Breaking and closing below its Daily Short Term Pivot Support Close at 0.375, may portend ISDN daily price action to test its End Weekly Intermediate Pivot Support Close at 0.35. As long as ISDN does not close below its End Weekly Intermediate Support Close at 0.35, there is a high probability that the most recent low of 0.335 may be well supported and becomes its consolidated low to date. But if ISDN closes below its End Weekly Intermediate Pivot Support Close at 0.35, its price action may potentially break its most recent support low of 0.335 and test its downside of its End Monthly Long Term Pivot Support Close at 0.27. Closing below 0.27 may portend very much lower price action. Due diligence is warranted. | ||||
| Useful To Me Not Useful To Me | |||||